2022 Maine House of Representatives election

| |||||||||||||||||||||||||||||
All 151 seats in the Maine House of Representatives 76 seats needed for a majority | |||||||||||||||||||||||||||||
|---|---|---|---|---|---|---|---|---|---|---|---|---|---|---|---|---|---|---|---|---|---|---|---|---|---|---|---|---|---|
| Registered | 1,145,052[1][2] ( | ||||||||||||||||||||||||||||
| Turnout | 59.47%[3] ( | ||||||||||||||||||||||||||||
| |||||||||||||||||||||||||||||
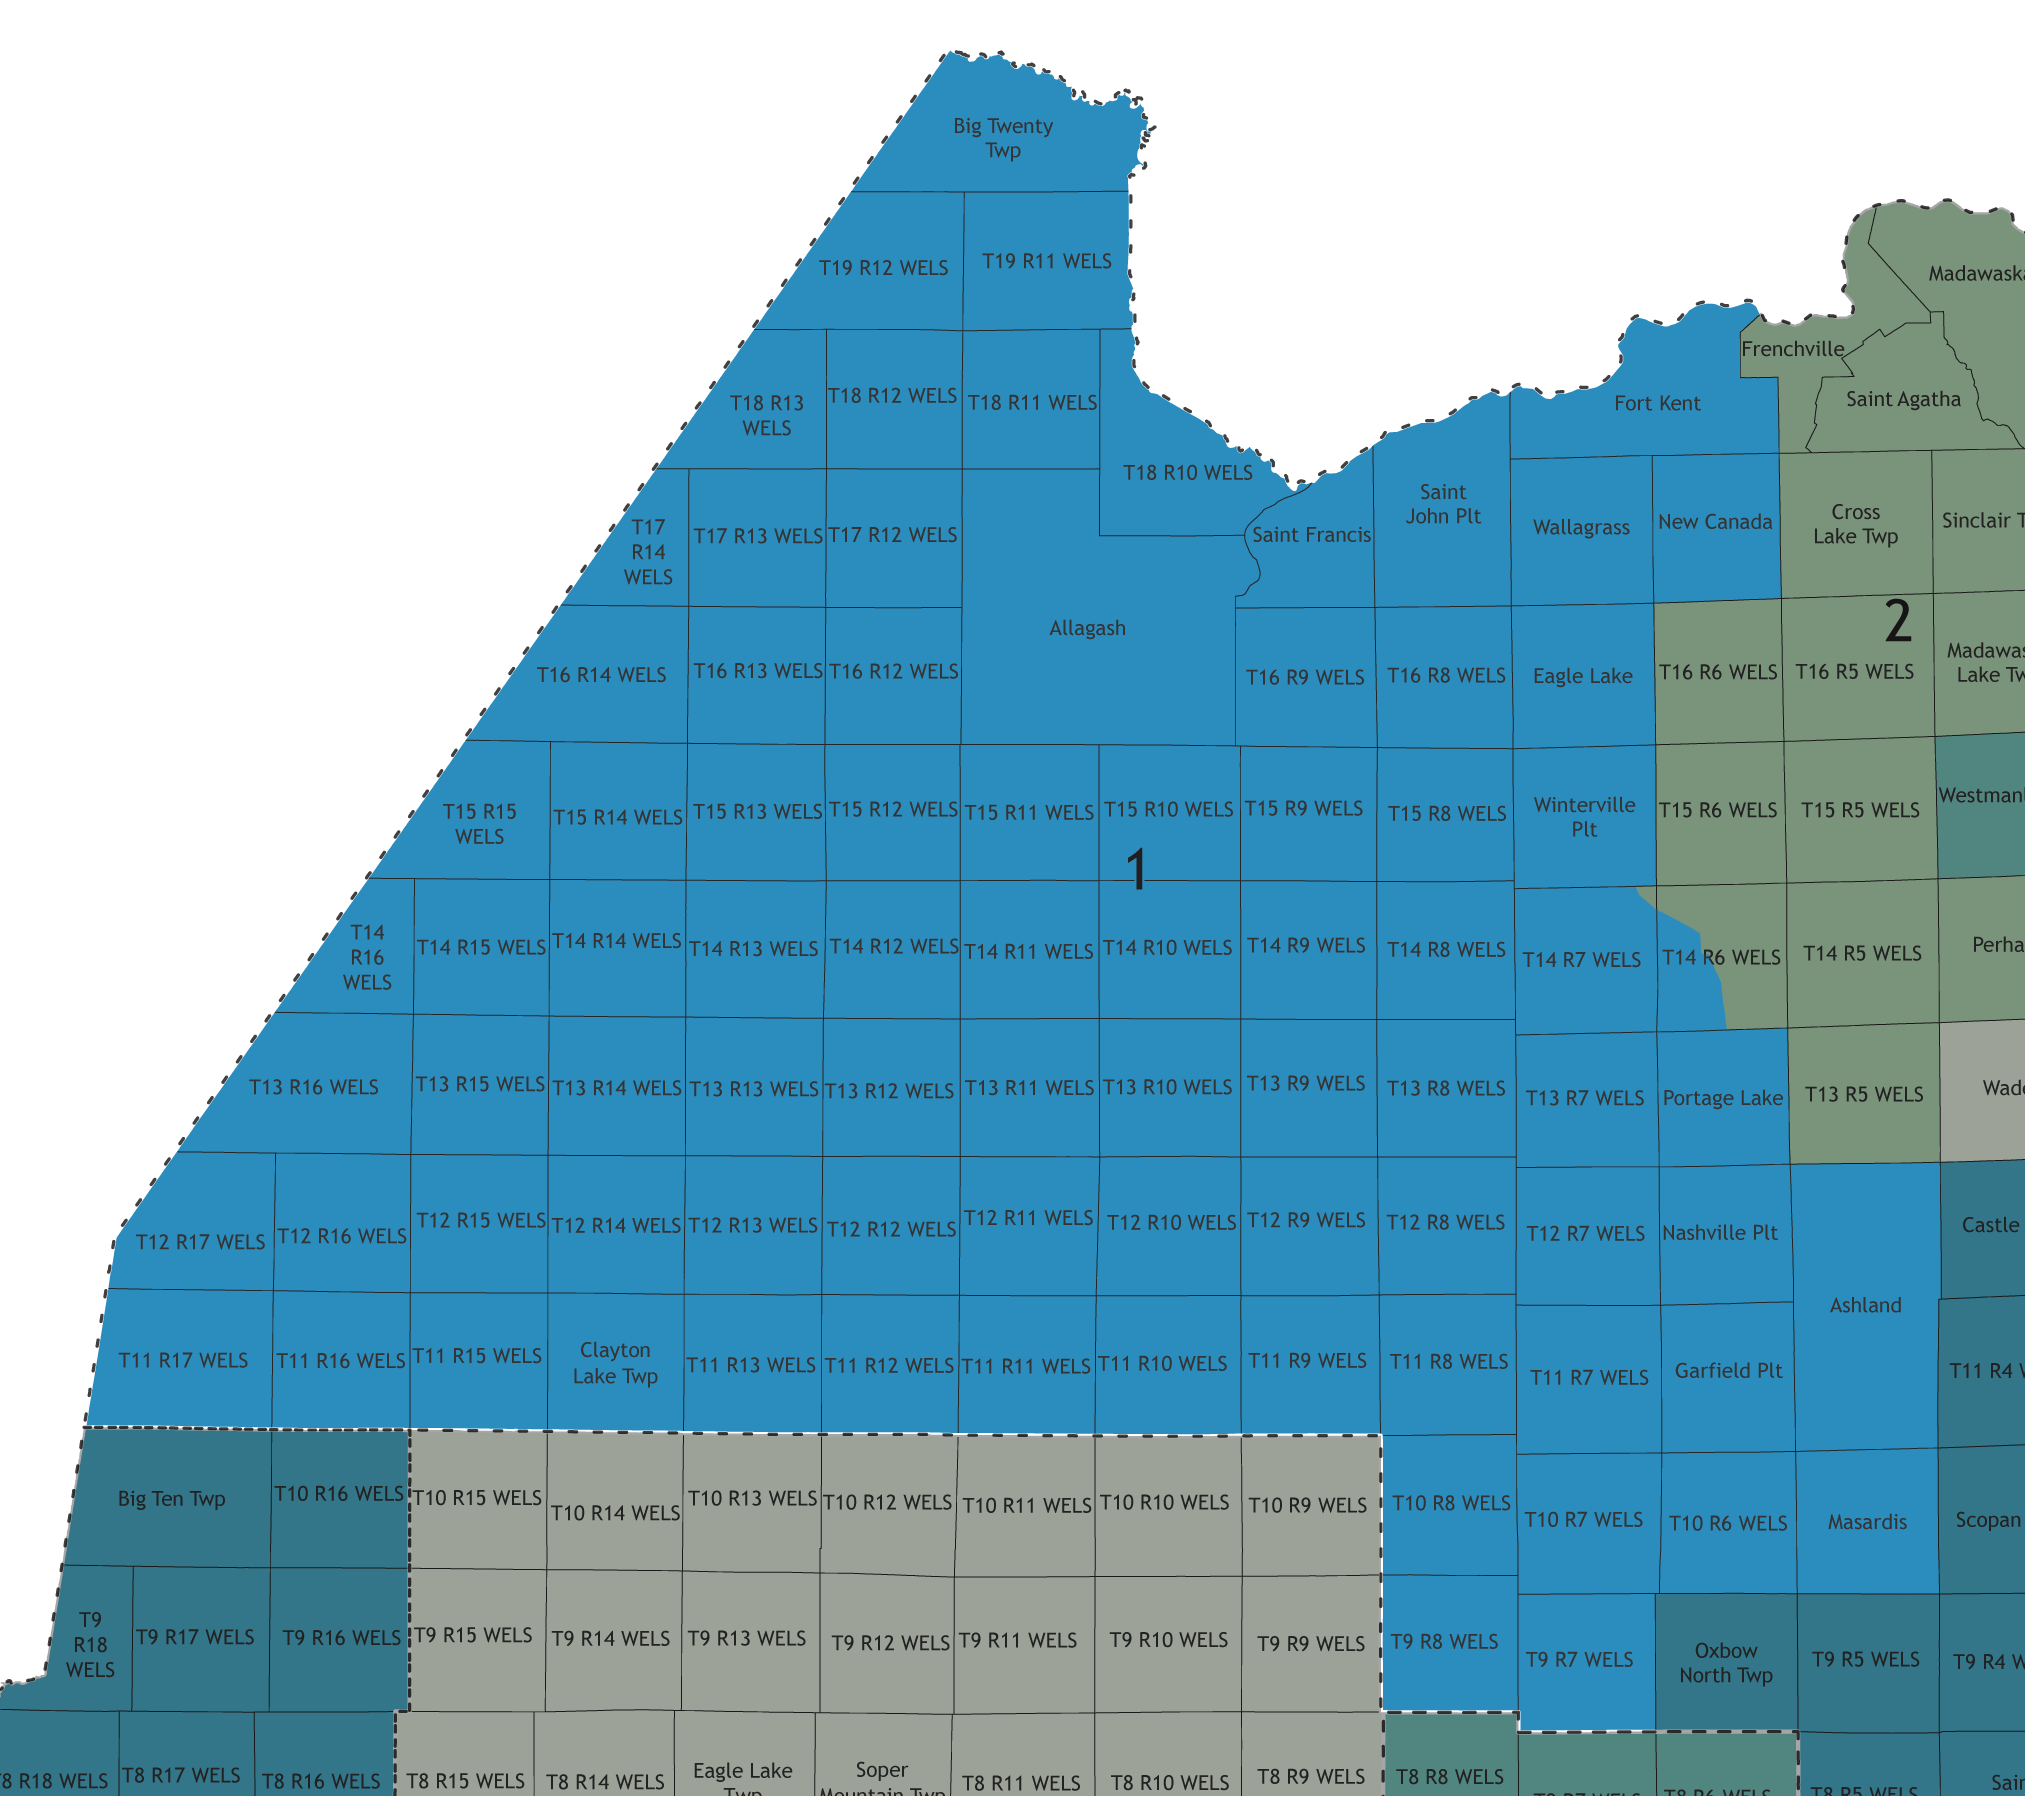
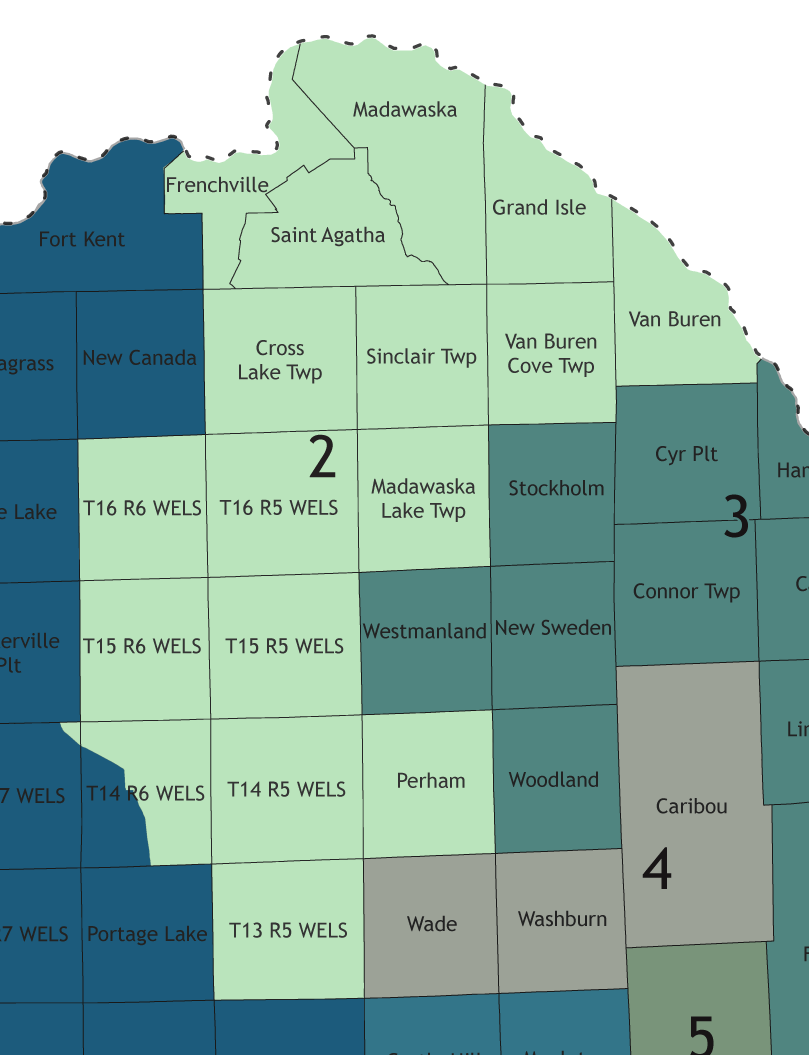
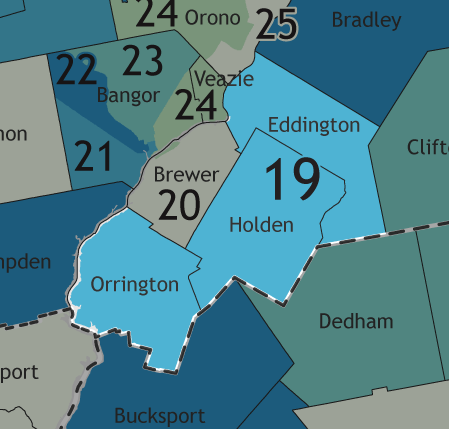
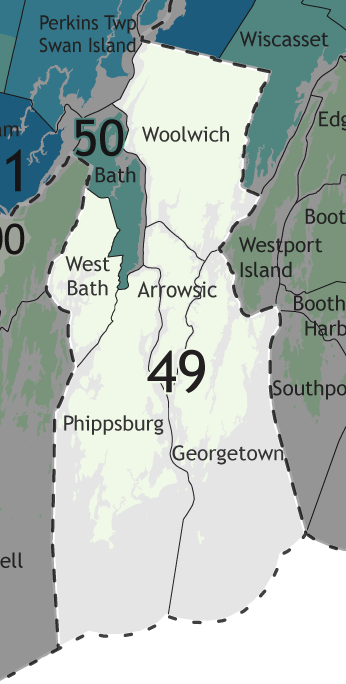
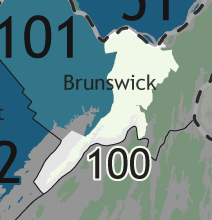
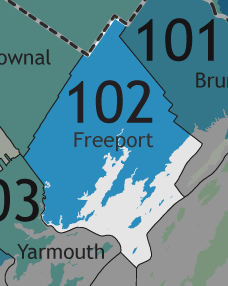
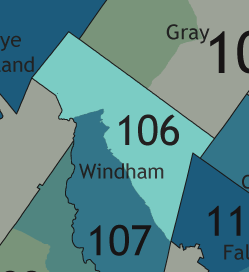
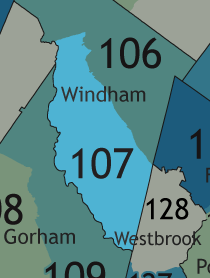
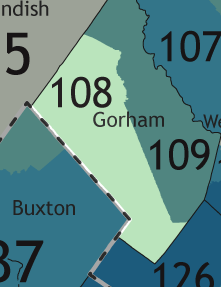
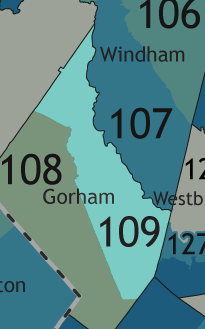
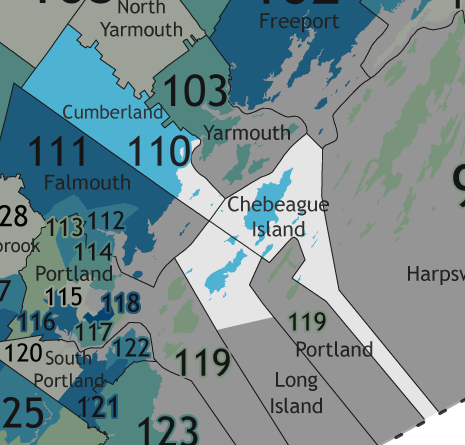
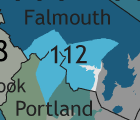
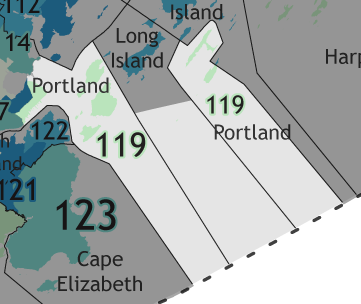
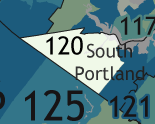
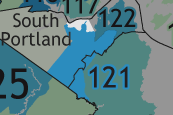
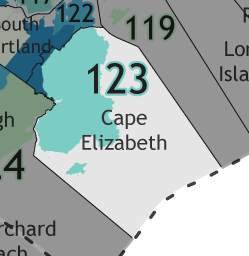
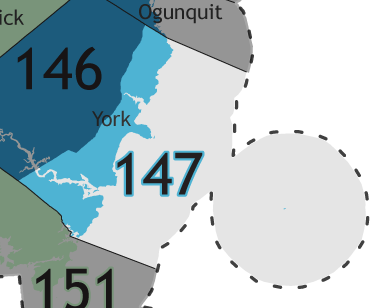
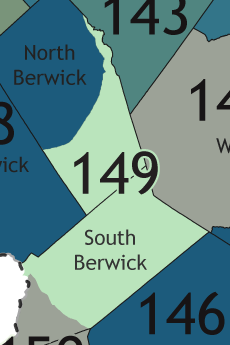
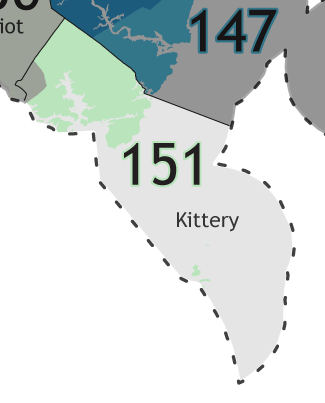
  Results: Democratic gain Republican gain Democratic hold Republican hold Independent hold Vote share: Republican: 40–50% 50–60% 60–70% 70–80% 80–90% >90% Democratic: 50–60% 60–70% 70–80% 80–90% >90% Independent: 50–60% | |||||||||||||||||||||||||||||
| Elections in Maine |
|---|
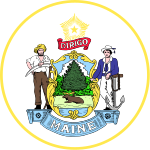 |
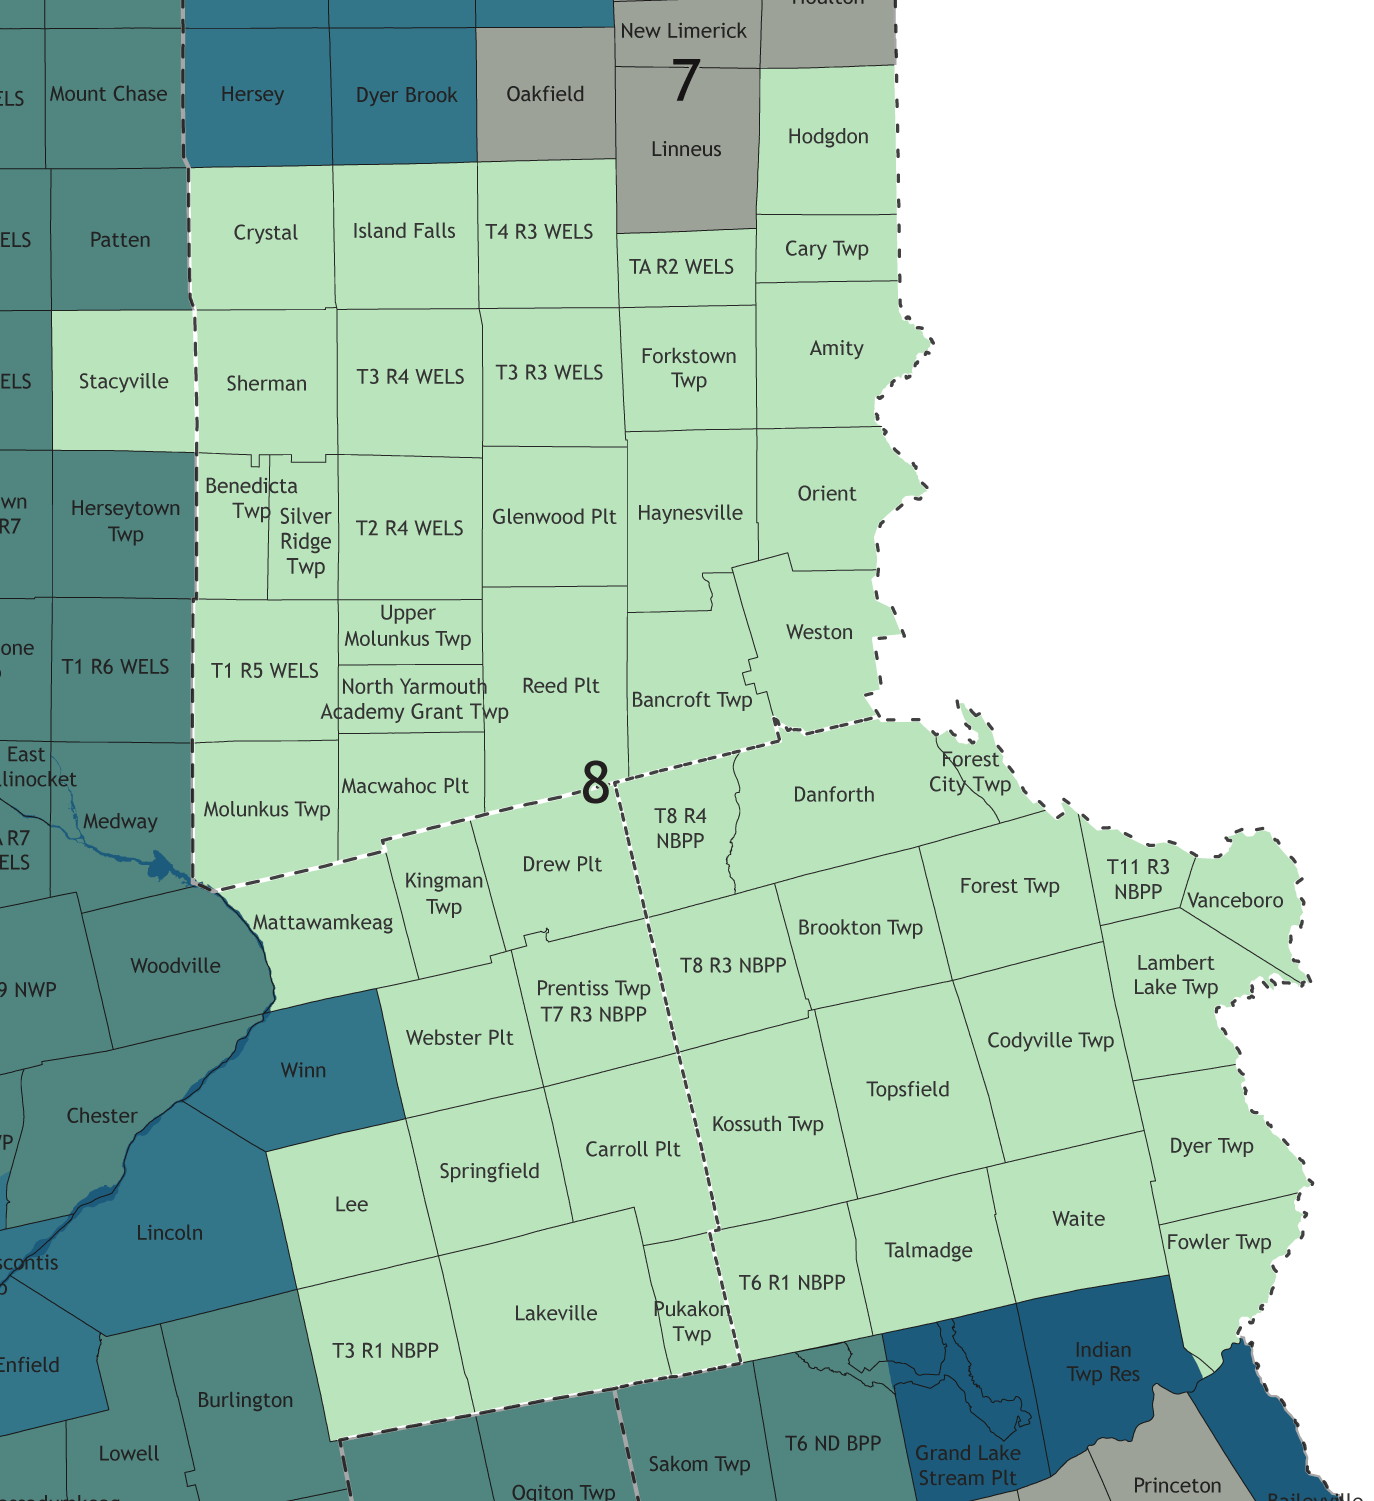
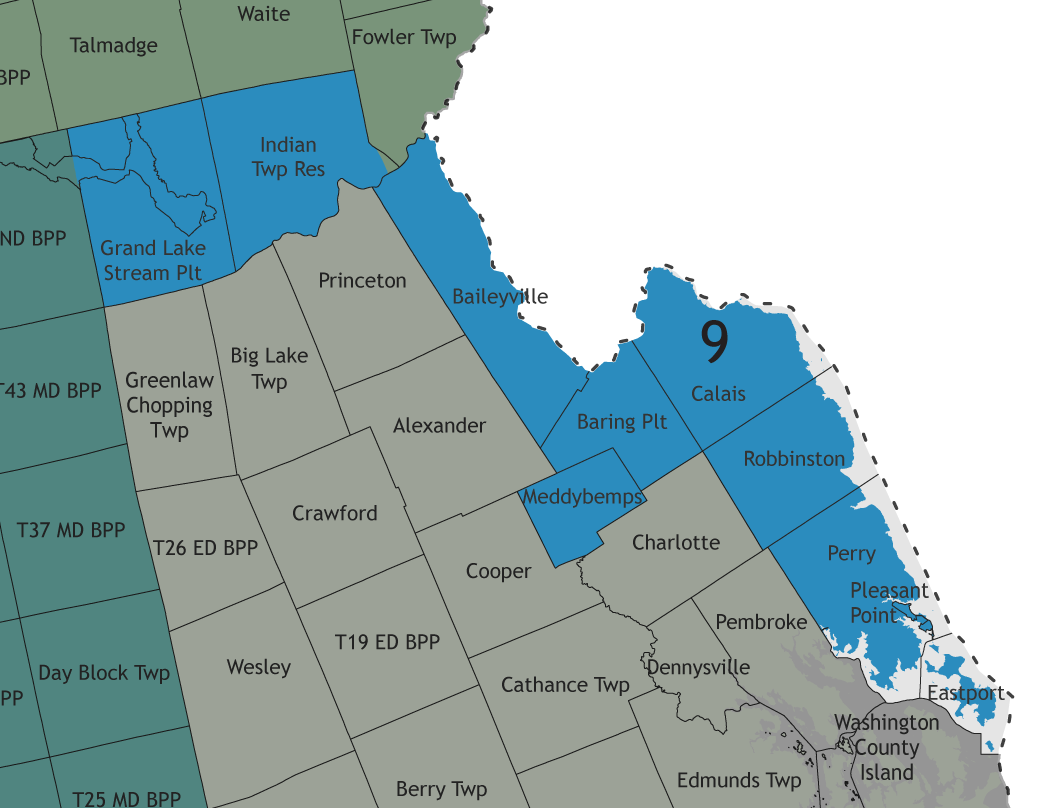
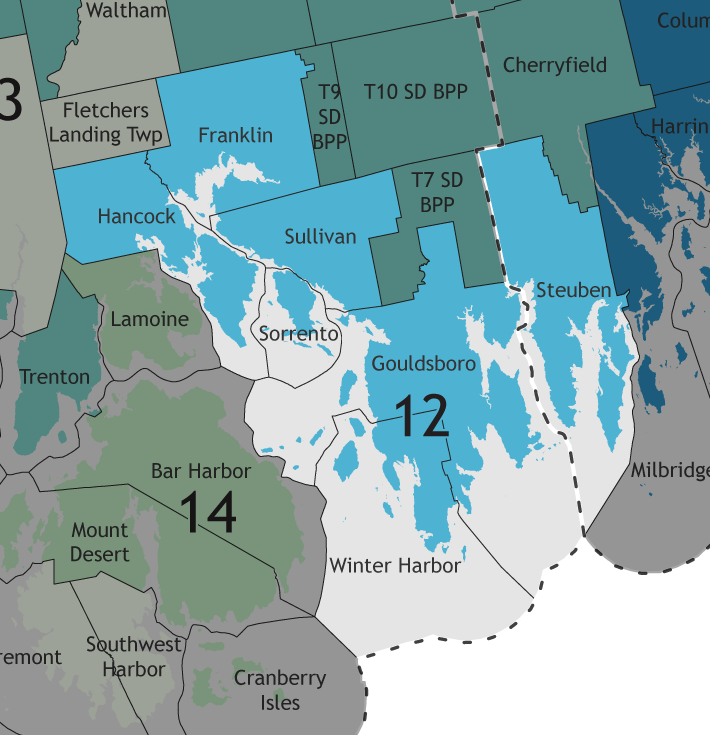
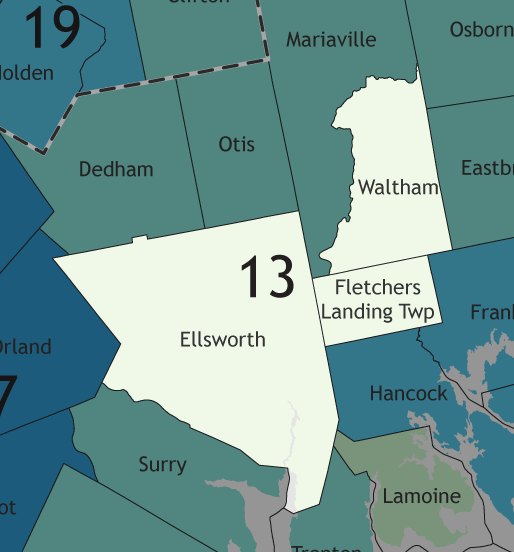
The 2022 Maine House of Representatives elections took place on November 8, 2022, alongside the biennial United States elections. Maine voters elected members of the Maine House of Representatives via instant-runoff voting in all 151 of the state house's districts, as well as a non-voting member from the Passamaquoddy Tribe. These were the first elections in Maine following the 2020 United States redistricting cycle, which resulted in nearly all members being assigned to new districts.
The election was also held alongside elections for the Maine Senate.
State representatives serve two-year terms in the Maine State House.
Democrats gained five seats and Republicans gained four seats, many of them previously vacant.[4]
Summary of results[edit]
Italics denote an open seat held by the incumbent party; bold text denotes a gain for a party.
Detailed results[edit]
Sources for election results: [9][10][11][12][13]
District 1[edit]
| Party | Candidate | Votes | % | |
|---|---|---|---|---|
| Democratic Party Primary Results | ||||
| Democratic | Toby D. Jandreau[b] | 303 | 100.00% | |
| Total votes | 303 | 100.00% | ||
| Republican Party Primary Results | ||||
| Republican | Austin L. Theriault | 348 | 100.00% | |
| Total votes | 348 | 100.00% | ||
| Party | Candidate | Votes | % | |
|---|---|---|---|---|
| Republican | Austin L. Theriault | 2,809 | 69.15% | |
| Democratic | Dana Marie Appleby | 1,253 | 30.85% | |
| Total votes | 4,062 | 100.00% | ||
| Republican gain from Democratic | ||||
District 2[edit]
| Party | Candidate | Votes | % | |
|---|---|---|---|---|
| Democratic Party Primary Results | ||||
| Democratic | Bernard Paradis | 385 | 100.00% | |
| Total votes | 385 | 100.00% | ||
| Republican Party Primary Results | ||||
| Republican | Roger Clarence Albert | 297 | 100.00% | |
| Total votes | 297 | 100.00% | ||
| Party | Candidate | Votes | % | |
|---|---|---|---|---|
| Republican | Roger Clarence Albert | 2,403 | 58.91% | |
| Democratic | Bernard Paradis | 1,676 | 41.09% | |
| Total votes | 4,079 | 100.00% | ||
| Republican gain from Democratic | ||||
District 3[edit]
| Party | Candidate | Votes | % | |
|---|---|---|---|---|
| Democratic Party Primary Results | ||||
| Democratic | David H. McCrea (incumbent) | 209 | 100.00% | |
| Total votes | 209 | 100.00% | ||
| Republican Party Primary Results | ||||
| Republican | Mark Michael Babin | 416 | 100.00% | |
| Total votes | 416 | 100.00% | ||
| Party | Candidate | Votes | % | |
|---|---|---|---|---|
| Republican | Mark Michael Babin | 2,065 | 51.75% | |
| Democratic | David H. McCrea (incumbent) | 1,925 | 48.25% | |
| Total votes | 3,990 | 100.00% | ||
| Republican gain from Democratic | ||||
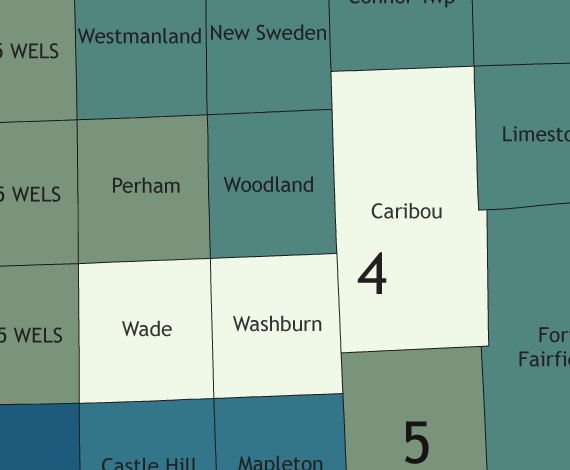
District 4[edit]
| Party | Candidate | Votes | % | |
|---|---|---|---|---|
| Democratic Party Primary Results | ||||
| Democratic | Jordyn Victoria Rossignol | 261 | 100.00% | |
| Total votes | 261 | 100.00% | ||
| Republican Party Primary Results | ||||
| Republican | Timothy C. Guerrette | 546 | 100.00% | |
| Total votes | 546 | 100.00% | ||
| Party | Candidate | Votes | % | |
|---|---|---|---|---|
| Republican | Timothy C. Guerrette | 2,387 | 63.76% | |
| Democratic | Jordyn Victoria Rossignol | 1,357 | 36.24% | |
| Total votes | 3,744 | 100.00% | ||
| Republican hold | ||||
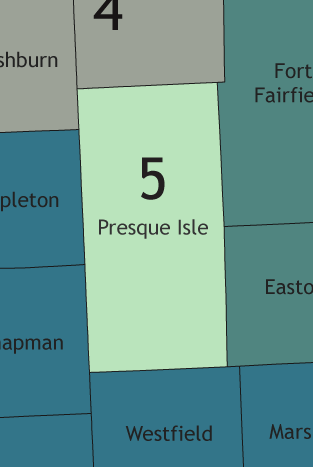
District 5[edit]
| Party | Candidate | Votes | % | |
|---|---|---|---|---|
| Democratic Party Primary Results | ||||
| Democratic | Kevin Gregory Freeman | 148 | 100.00% | |
| Total votes | 148 | 100.00% | ||
| Republican Party Primary Results | ||||
| Republican | Joseph F. Underwood (incumbent) | 263 | 100.00% | |
| Total votes | 263 | 100.00% | ||
| Party | Candidate | Votes | % | |
|---|---|---|---|---|
| Republican | Joseph F. Underwood (incumbent) | 1,857 | 57.05% | |
| Democratic | Kevin Gregory Freeman | 1,398 | 42.95% | |
| Total votes | 3,255 | 100.00% | ||
| Republican hold | ||||
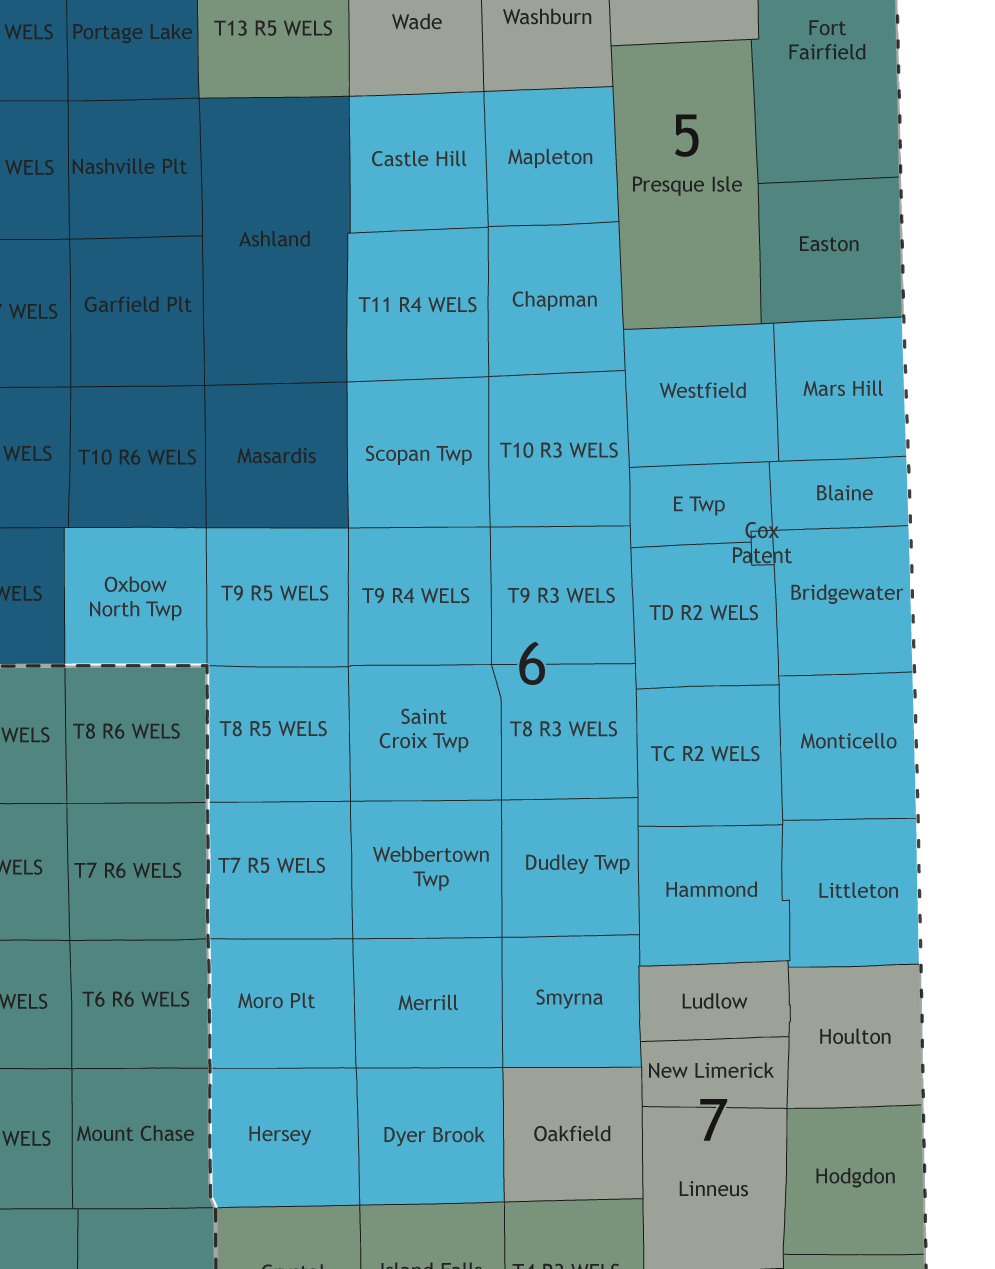
District 6[edit]
| Party | Candidate | Votes | % | |
|---|---|---|---|---|
| Republican Party Primary Results | ||||
| Republican | Donald J. Ardell | 451 | 100.00% | |
| Total votes | 451 | 100.00% | ||
| Party | Candidate | Votes | % | |
|---|---|---|---|---|
| Republican | Donald J. Ardell | 3,294 | 100.00% | |
| Total votes | 3,294 | 100.00% | ||
| Republican hold | ||||
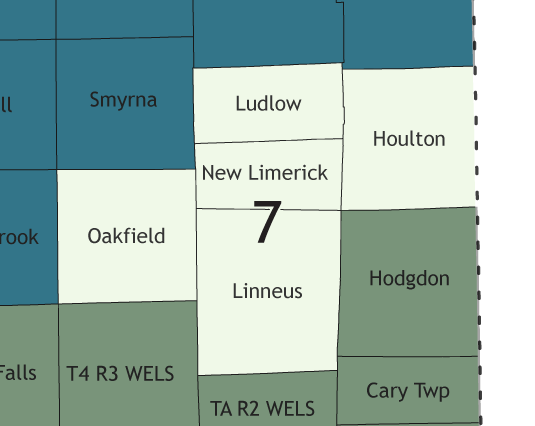
District 7[edit]
| Party | Candidate | Votes | % | |
|---|---|---|---|---|
| Democratic Party Primary Results | ||||
| Democratic | Michael E. Carpenter[c] | 91 | 100.00% | |
| Total votes | 91 | 100.00% | ||
| Republican Party Primary Results | ||||
| Republican | Gregory L. Swallow | 323 | 100.00% | |
| Total votes | 323 | 100.00% | ||
| Party | Candidate | Votes | % | ||
|---|---|---|---|---|---|
| Republican | Gregory L. Swallow | 2,752 | 100.00% | ||
| Total votes | 2,752 | 100.00% | |||
| Republican win (new seat) | |||||
District 8[edit]
| Party | Candidate | Votes | % | |
|---|---|---|---|---|
| Democratic Party Primary Results | ||||
| Democratic | Kevin B. Ritchie | 159 | 100.00% | |
| Total votes | 159 | 100.00% | ||
| Republican Party Primary Results | ||||
| Republican | Tracy Lynn Quint (incumbent) | 542 | 100.00% | |
| Total votes | 542 | 100.00% | ||
| Party | Candidate | Votes | % | |
|---|---|---|---|---|
| Republican | Tracy Lynn Quint (incumbent) | 2,966 | 72.82% | |
| Democratic | Kevin B. Ritchie | 1,107 | 27.18% | |
| Total votes | 4,073 | 100.00% | ||
| Republican hold | ||||
District 9[edit]
| Party | Candidate | Votes | % | |
|---|---|---|---|---|
| Democratic Party Primary Results | ||||
| Democratic | Anne C. Perry (incumbent) | 218 | 100.00% | |
| Total votes | 218 | 100.00% | ||
| Republican Party Primary Results | ||||
| Republican | John Victor Chambers | 353 | 100.00% | |
| Total votes | 353 | 100.00% | ||
| Party | Candidate | Votes | % | |
|---|---|---|---|---|
| Democratic | Anne C. Perry (incumbent) | 1,947 | 52.99% | |
| Republican | John Victor Chambers | 1,727 | 47.01% | |
| Total votes | 3,674 | 100.00% | ||
| Democratic hold | ||||
District 10[edit]
| Party | Candidate | Votes | % | |
|---|---|---|---|---|
| Republican Party Primary Results | ||||
| Republican | Kenneth Ralph Davis, Jr. | 588 | 100.00% | |
| Total votes | 588 | 100.00% | ||
| Party | Candidate | Votes | % | |
|---|---|---|---|---|
| Republican | Kenneth Ralph Davis, Jr. | 2,777 | 61.07% | |
| Independent | Melissa Louisa Hinerman[d] | 1,770 | 38.93% | |
| Total votes | 4,547 | 100.00% | ||
| Republican gain from Democratic | ||||
District 11[edit]
| Party | Candidate | Votes | % | |
|---|---|---|---|---|
| Democratic Party Primary Results | ||||
| Democratic | Roland Eben Rogers III | 190 | 100.00% | |
| Total votes | 190 | 100.00% | ||
| Republican Party Primary Results | ||||
| Republican | Tiffany Strout | 448 | 61.71% | |
| Republican | Kendall M. Alley | 278 | 38.29% | |
| Total votes | 726 | 100.00% | ||
| Party | Candidate | Votes | % | |
|---|---|---|---|---|
| Republican | Tiffany Strout | 3,031 | 68.02% | |
| Democratic | Roland Eben Rogers III | 1,425 | 31.98% | |
| Total votes | 4,456 | 100.00% | ||
| Republican hold | ||||
District 12[edit]
| Party | Candidate | Votes | % | |
|---|---|---|---|---|
| Republican Party Primary Results | ||||
| Republican | Billy Bob Faulkingham (incumbent) | 744 | 100.00% | |
| Total votes | 744 | 100.00% | ||
| Party | Candidate | Votes | % | |
|---|---|---|---|---|
| Republican | Billy Bob Faulkingham (incumbent) | 2,727 | 60.16% | |
| Independent | Roy D. Gott[d] | 1,806 | 39.84% | |
| Total votes | 4,533 | 100.00% | ||
| Republican hold | ||||
District 13[edit]
| Party | Candidate | Votes | % | |
|---|---|---|---|---|
| Democratic Party Primary Results | ||||
| Democratic | Barbara W. Reeve[e] | 703 | 100.00% | |
| Total votes | 703 | 100.00% | ||
| Republican Party Primary Results | ||||
| Republican | John Linnehan | 600 | 100.00% | |
| Total votes | 600 | 100.00% | ||
| Party | Candidate | Votes | % | ||
|---|---|---|---|---|---|
| Democratic | J. Mark Worth | 2,371 | 57.90% | ||
| Republican | John Linnehan | 1,724 | 42.10% | ||
| Total votes | 4,095 | 100.00% | |||
| Democratic win (new seat) | |||||
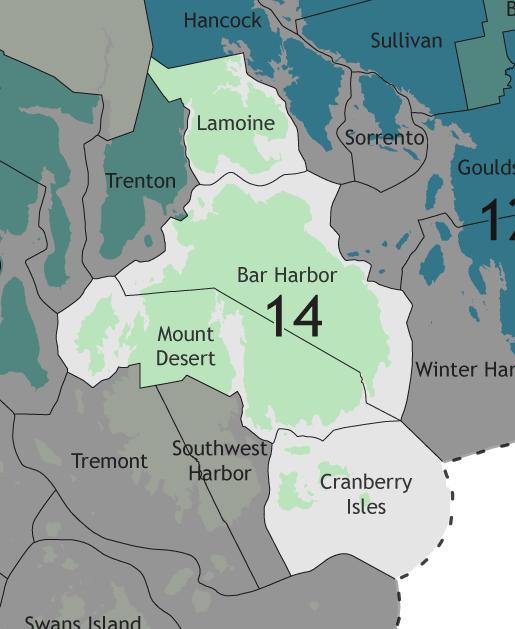
District 14[edit]
| Party | Candidate | Votes | % | |
|---|---|---|---|---|
| Democratic Party Primary Results | ||||
| Democratic | Lynne A. Williams (incumbent) | 1,522 | 100.00% | |
| Total votes | 1,522 | 100.00% | ||
| Republican Party Primary Results | ||||
| Republican | Stephen A. Coston | 307 | 61.52% | |
| Republican | Duncan G. Haass | 192 | 38.48% | |
| Total votes | 499 | 100.00% | ||
| Party | Candidate | Votes | % | |
|---|---|---|---|---|
| Democratic | Lynne A. Williams (incumbent) | 3,620 | 66.62% | |
| Republican | Stephen A. Coston | 1,814 | 33.38% | |
| Total votes | 5,434 | 100.00% | ||
| Democratic hold | ||||
District 15[edit]
| Party | Candidate | Votes | % | |
|---|---|---|---|---|
| Democratic Party Primary Results | ||||
| Democratic | Holly Eaton | 1,071 | 100.00% | |
| Total votes | 1,071 | 100.00% | ||
| Republican Party Primary Results | ||||
| Republican | Jason Manantan Joyce | 427 | 100.00% | |
| Total votes | 427 | 100.00% | ||
| Party | Candidate | Votes | % | ||
|---|---|---|---|---|---|
| Democratic | Holly Eaton | 2,865 | 54.24% | ||
| Republican | Jason Joyce | 2,417 | 45.76% | ||
| Total votes | 5,282 | 100.00% | |||
| Democratic win (new seat) | |||||
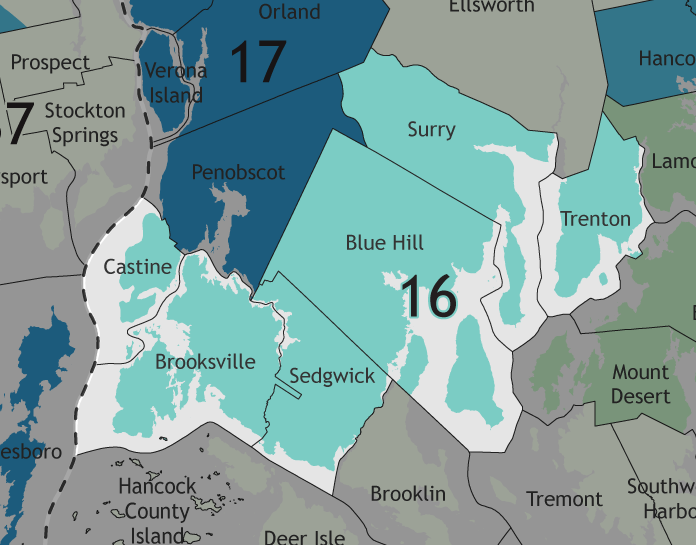
District 16[edit]
| Party | Candidate | Votes | % | |
|---|---|---|---|---|
| Democratic Party Primary Results | ||||
| Democratic | Nina Azella Milliken | 1,307 | 100.00% | |
| Total votes | 1,307 | 100.00% | ||
| Republican Party Primary Results | ||||
| Republican | Stephen M. Hanrahan III | 483 | 100.00% | |
| Total votes | 483 | 100.00% | ||
| Party | Candidate | Votes | % | |
|---|---|---|---|---|
| Democratic | Nina Azella Milliken | 3,396 | 63.80% | |
| Republican | Stephen M. Hanrahan III | 1,927 | 36.20% | |
| Total votes | 5,323 | 100.00% | ||
| Democratic hold | ||||
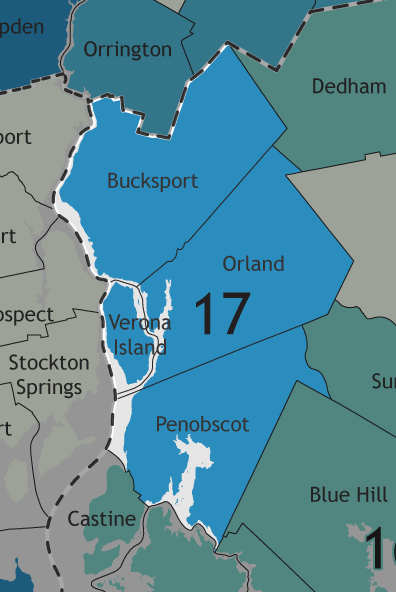
District 17[edit]
| Party | Candidate | Votes | % | |
|---|---|---|---|---|
| Democratic Party Primary Results | ||||
| Democratic | Pamela W. Person[f] | 368 | 100.00% | |
| Total votes | 368 | 100.00% | ||
| Republican Party Primary Results | ||||
| Republican | Sherman H. Hutchins (incumbent) | 468 | 100.00% | |
| Total votes | 468 | 100.00% | ||
| Party | Candidate | Votes | % | |
|---|---|---|---|---|
| Democratic | Ronald B. Russell | 2,398 | 51.70% | |
| Republican | Sherman H. Hutchins (incumbent) | 2,240 | 48.30% | |
| Total votes | 4,638 | 100.00% | ||
| Democratic gain from Republican | ||||
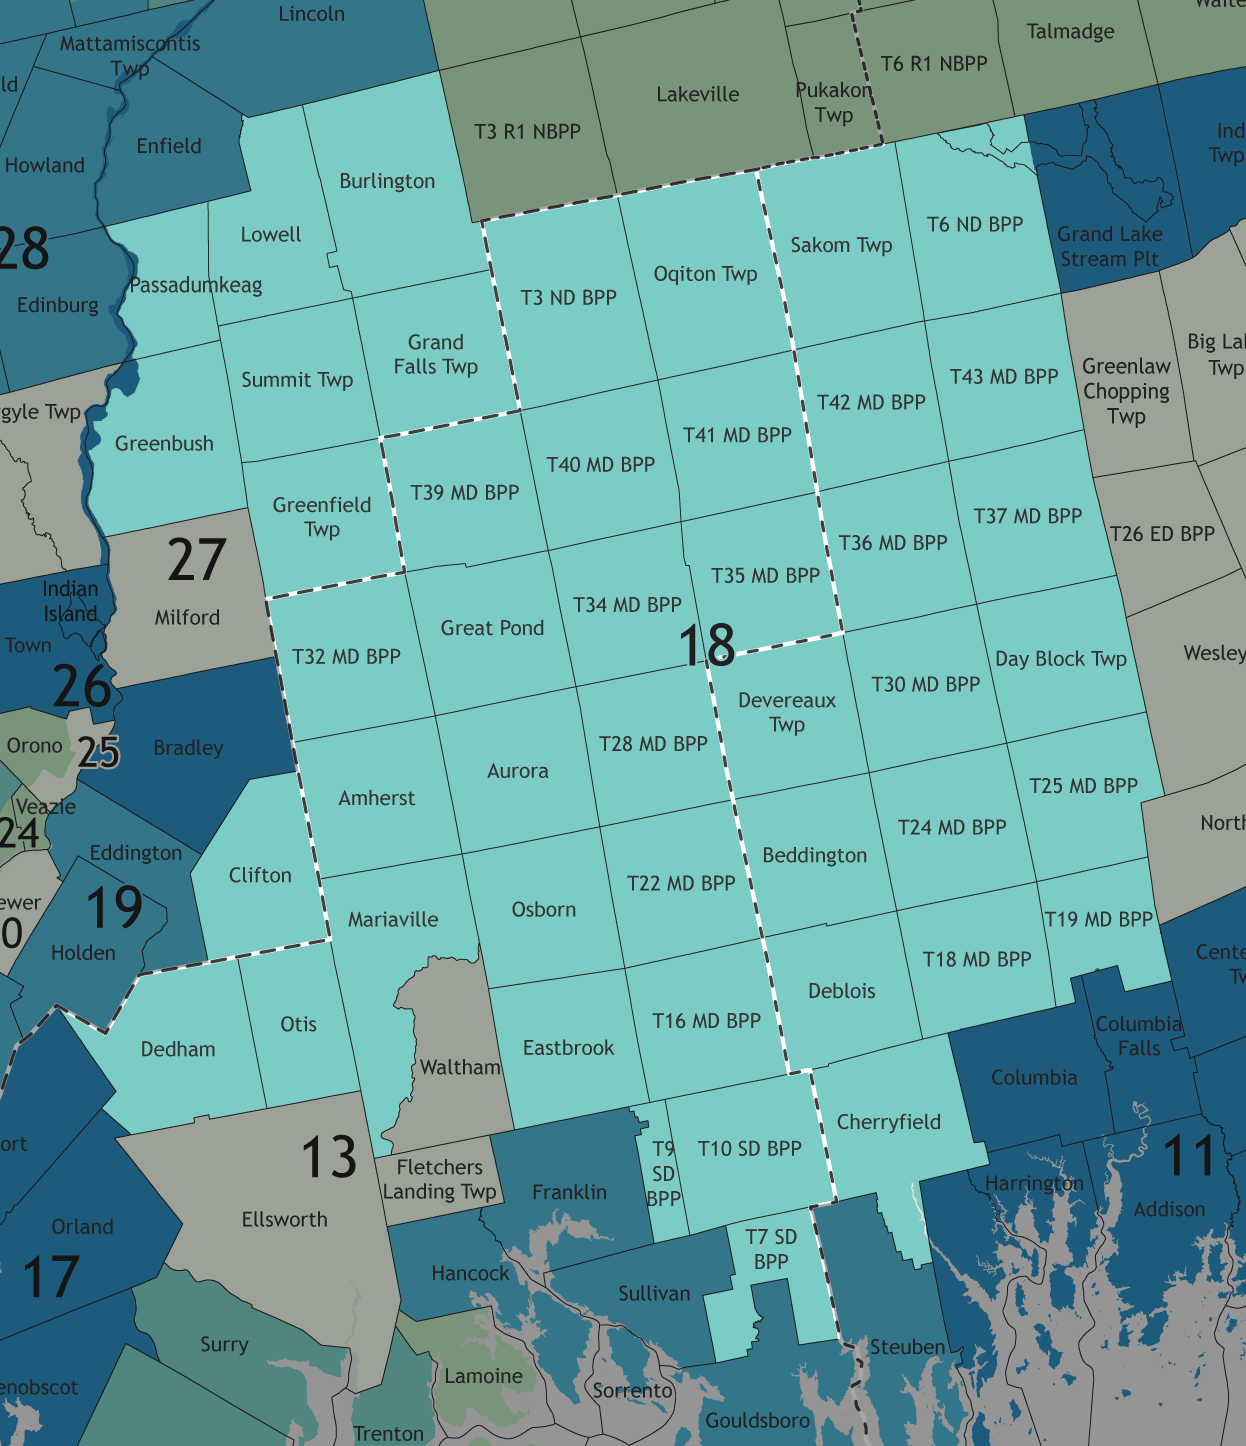
District 18[edit]
| Party | Candidate | Votes | % | |
|---|---|---|---|---|
| Democratic Party Primary Results | ||||
| Democratic | Timothy B. Throckmorton | 244 | 100.00% | |
| Total votes | 244 | 100.00% | ||
| Republican Party Primary Results | ||||
| Republican | Meldon H. Carmichael (incumbent) | 660 | 100.00% | |
| Total votes | 660 | 100.00% | ||
| Party | Candidate | Votes | % | |
|---|---|---|---|---|
| Republican | Meldon H. Carmichael (incumbent) | 2,697 | 59.29% | |
| Democratic | Timothy B. Throckmorton | 1,852 | 40.71% | |
| Total votes | 4,549 | 100.00% | ||
| Republican hold | ||||
District 19[edit]
| Party | Candidate | Votes | % | |
|---|---|---|---|---|
| Republican Party Primary Results | ||||
| Republican | Richard H. Campbell | 728 | 100.00% | |
| Total votes | 728 | 100.00% | ||
| Party | Candidate | Votes | % | |
|---|---|---|---|---|
| Republican | Richard H. Campbell | 4,043 | 100.00% | |
| Total votes | 4,043 | 100.00% | ||
| Republican hold | ||||
District 20[edit]
| Party | Candidate | Votes | % | |
|---|---|---|---|---|
| Democratic Party Primary Results | ||||
| Democratic | Kevin J.M. O'Connell (incumbent) | 205 | 100.00% | |
| Total votes | 205 | 100.00% | ||
| Republican Party Primary Results | ||||
| Republican | Jennifer Marie Morin | 463 | 100.00% | |
| Total votes | 463 | 100.00% | ||
| Party | Candidate | Votes | % | |
|---|---|---|---|---|
| Democratic | Kevin J.M. O'Connell (incumbent) | 2,057 | 50.65% | |
| Republican | Jennifer Marie Morin | 2,004 | 49.35% | |
| Total votes | 4,061 | 100.00% | ||
| Democratic hold | ||||
District 21[edit]
| Party | Candidate | Votes | % | |
|---|---|---|---|---|
| Democratic Party Primary Results | ||||
| Democratic | Barbara A. Cardone (incumbent)[g] | 427 | 100.00% | |
| Total votes | 427 | 100.00% | ||
| Party | Candidate | Votes | % | ||
|---|---|---|---|---|---|
| Democratic | Ambureen Rana | 1,878 | 58.18% | ||
| Independent | Marianna H. Reeves | 1,350 | 41.82% | ||
| Total votes | 3,228 | 100.00% | |||
| Democratic win (new seat) | |||||
District 22[edit]
| Party | Candidate | Votes | % | |
|---|---|---|---|---|
| Democratic Party Primary Results | ||||
| Democratic | Laura D. Supica (incumbent) | 265 | 100.00% | |
| Total votes | 265 | 100.00% | ||
| Republican Party Primary Results | ||||
| Republican | Douglas K. Damon | 193 | 100.00% | |
| Total votes | 193 | 100.00% | ||
| Party | Candidate | Votes | % | |
|---|---|---|---|---|
| Democratic | Laura D. Supica (incumbent) | 1,653 | 58.43% | |
| Republican | Douglas K. Damon | 1,176 | 41.57% | |
| Total votes | 2,829 | 100.00% | ||
| Democratic hold | ||||
District 23[edit]
| Party | Candidate | Votes | % | |
|---|---|---|---|---|
| Democratic Party Primary Results | ||||
| Democratic | Amy J. Roeder (incumbent) | 431 | 100.00% | |
| Total votes | 431 | 100.00% | ||
| Republican Party Primary Results | ||||
| Republican | David J. Pece[h] | 259 | 100.00% | |
| Total votes | 259 | 100.00% | ||
| Party | Candidate | Votes | % | |
|---|---|---|---|---|
| Democratic | Amy J. Roeder (incumbent) | 2,563 | 100.00% | |
| Total votes | 2,563 | 100.00% | ||
| Democratic hold | ||||
District 24[edit]
| Party | Candidate | Votes | % | |
|---|---|---|---|---|
| Democratic Party Primary Results | ||||
| Democratic | Joseph C. Perry (incumbent) | 714 | 100.00% | |
| Total votes | 714 | 100.00% | ||
| Republican Party Primary Results | ||||
| Republican | Roderick Allen Hathaway | 301 | 100.00% | |
| Total votes | 301 | 100.00% | ||
| Party | Candidate | Votes | % | |
|---|---|---|---|---|
| Democratic | Joseph C. Perry (incumbent) | 2,465 | 62.58% | |
| Republican | Roderick Allen Hathaway | 1,474 | 37.42% | |
| Total votes | 3,939 | 100.00% | ||
| Democratic hold | ||||
District 25[edit]
| Party | Candidate | Votes | % | |
|---|---|---|---|---|
| Democratic Party Primary Results | ||||
| Democratic | Laurie J. Osher (incumbent) | 389 | 100.00% | |
| Total votes | 389 | 100.00% | ||
| Republican Party Primary Results | ||||
| Republican | Cameron S. Bowie | 55 | 100.00% | |
| Total votes | 55 | 100.00% | ||
| Party | Candidate | Votes | % | |
|---|---|---|---|---|
| Democratic | Laurie J. Osher (incumbent) | 1,842 | 78.42% | |
| Republican | Cameron S. Bowie | 507 | 21.58% | |
| Total votes | 2,349 | 100.00% | ||
| Democratic hold | ||||
District 26[edit]
| Party | Candidate | Votes | % | |
|---|---|---|---|---|
| Democratic Party Primary Results | ||||
| Democratic | James F. Dill | 537 | 100.00% | |
| Total votes | 537 | 100.00% | ||
| Republican Party Primary Results | ||||
| Republican | Christina M. Ouellette | 272 | 100.00% | |
| Total votes | 272 | 100.00% | ||
| Party | Candidate | Votes | % | |
|---|---|---|---|---|
| Democratic | James F. Dill | 2,419 | 59.49% | |
| Republican | Christina M. Ouellette | 1,647 | 40.51% | |
| Total votes | 4,066 | 100.00% | ||
| Democratic hold | ||||
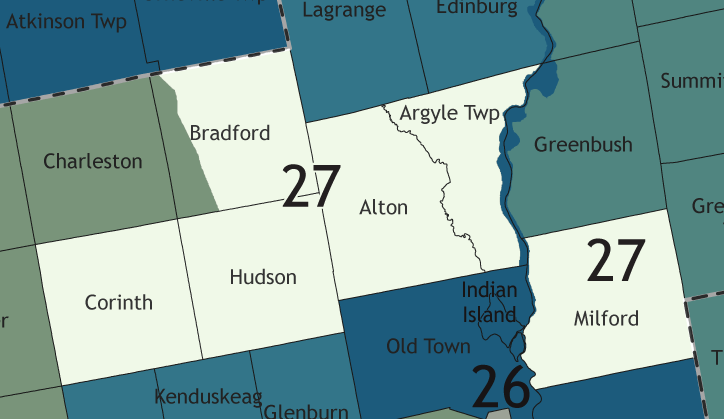
District 27[edit]
| Party | Candidate | Votes | % | |
|---|---|---|---|---|
| Democratic Party Primary Results | ||||
| Democratic | Julie Vaillancourt[i] | 264 | 100.00% | |
| Total votes | 264 | 100.00% | ||
| Republican Party Primary Results | ||||
| Republican | Gary Drinkwater (incumbent) | 651 | 100.00% | |
| Total votes | 651 | 100.00% | ||
| Party | Candidate | Votes | % | |
|---|---|---|---|---|
| Republican | Gary Drinkwater (incumbent) | 3,030 | 69.19% | |
| Democratic | Peter A. Crockett | 1,349 | 30.81% | |
| Total votes | 4,379 | 100.00% | ||
| Republican hold | ||||
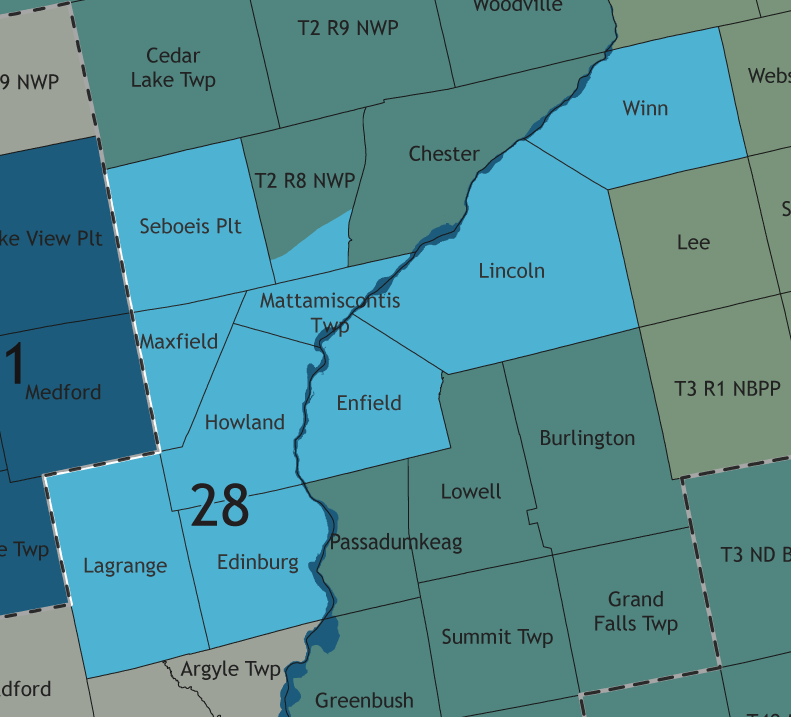
District 28[edit]
| Party | Candidate | Votes | % | |
|---|---|---|---|---|
| Democratic Party Primary Results | ||||
| Democratic | Natalie D. DiPentino | 306 | 100.00% | |
| Total votes | 306 | 100.00% | ||
| Republican Party Primary Results | ||||
| Republican | Jeffery Allen Gifford (incumbent)[j] | 395 | 100.00% | |
| Total votes | 395 | 100.00% | ||
| Party | Candidate | Votes | % | ||
|---|---|---|---|---|---|
| Republican | Irene A. Gifford | 2,840 | 70.93% | ||
| Democratic | Natalie D. DiPentino | 1,164 | 29.07% | ||
| Total votes | 4,004 | 100.00% | |||
| Republican win (new seat) | |||||
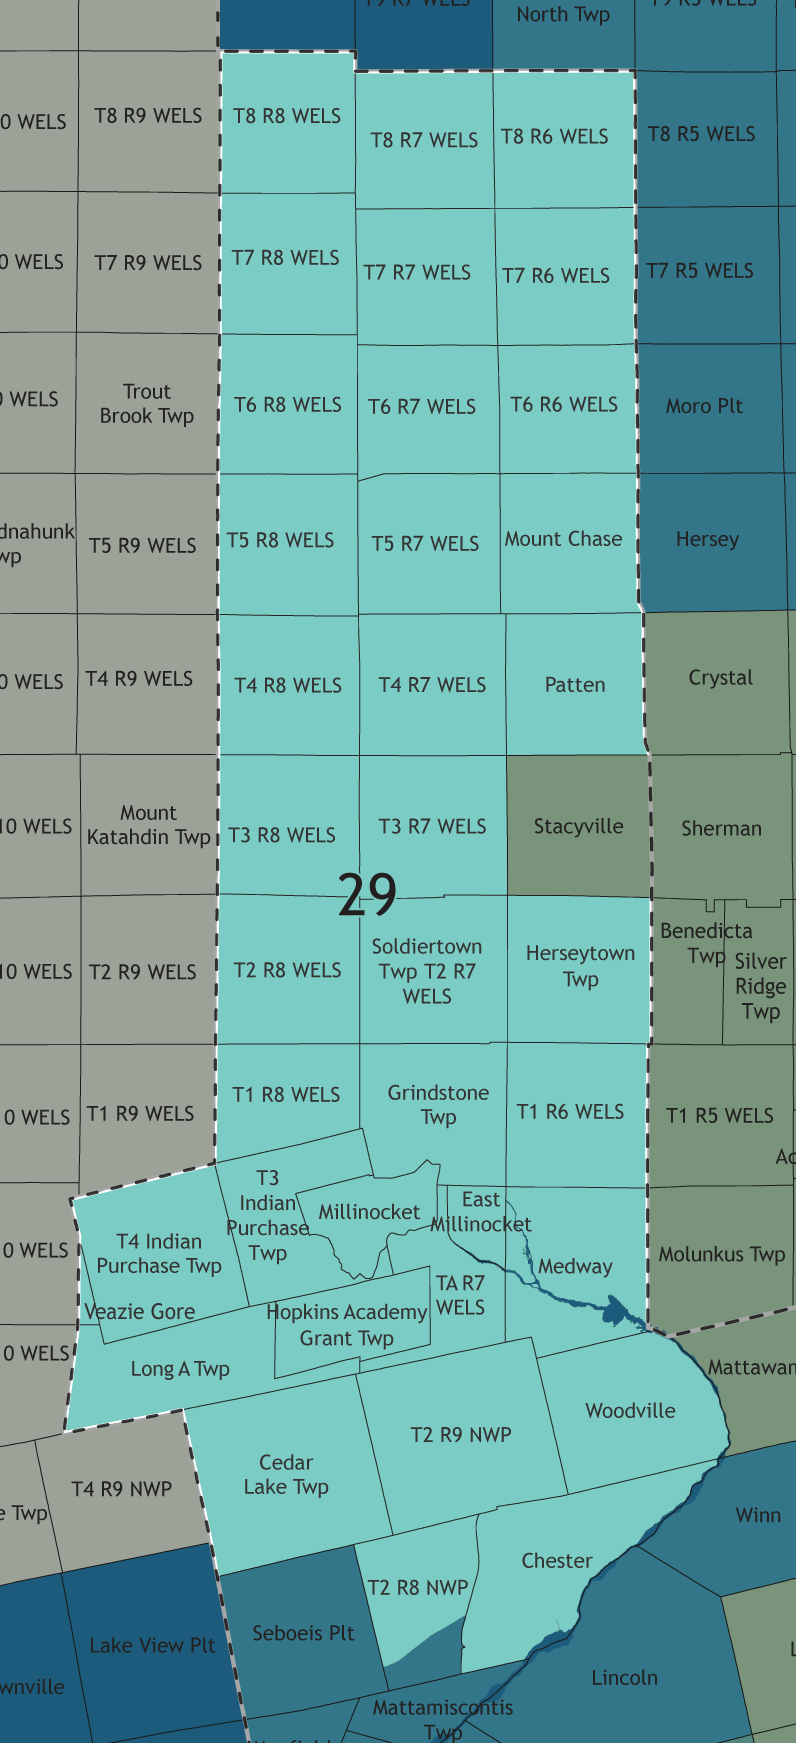
District 29[edit]
| Party | Candidate | Votes | % | |
|---|---|---|---|---|
| Democratic Party Primary Results | ||||
| Democratic | Laurie E. York | 252 | 100.00% | |
| Total votes | 252 | 100.00% | ||
| Republican Party Primary Results | ||||
| Republican | Kathy Irene Javner (incumbent) | 542 | 100.00% | |
| Total votes | 542 | 100.00% | ||
| Party | Candidate | Votes | % | |
|---|---|---|---|---|
| Republican | Kathy Irene Javner (incumbent) | 2,549 | 58.54% | |
| Democratic | Laurie E. York | 1,805 | 41.46% | |
| Total votes | 4,354 | 100.00% | ||
| Republican hold | ||||
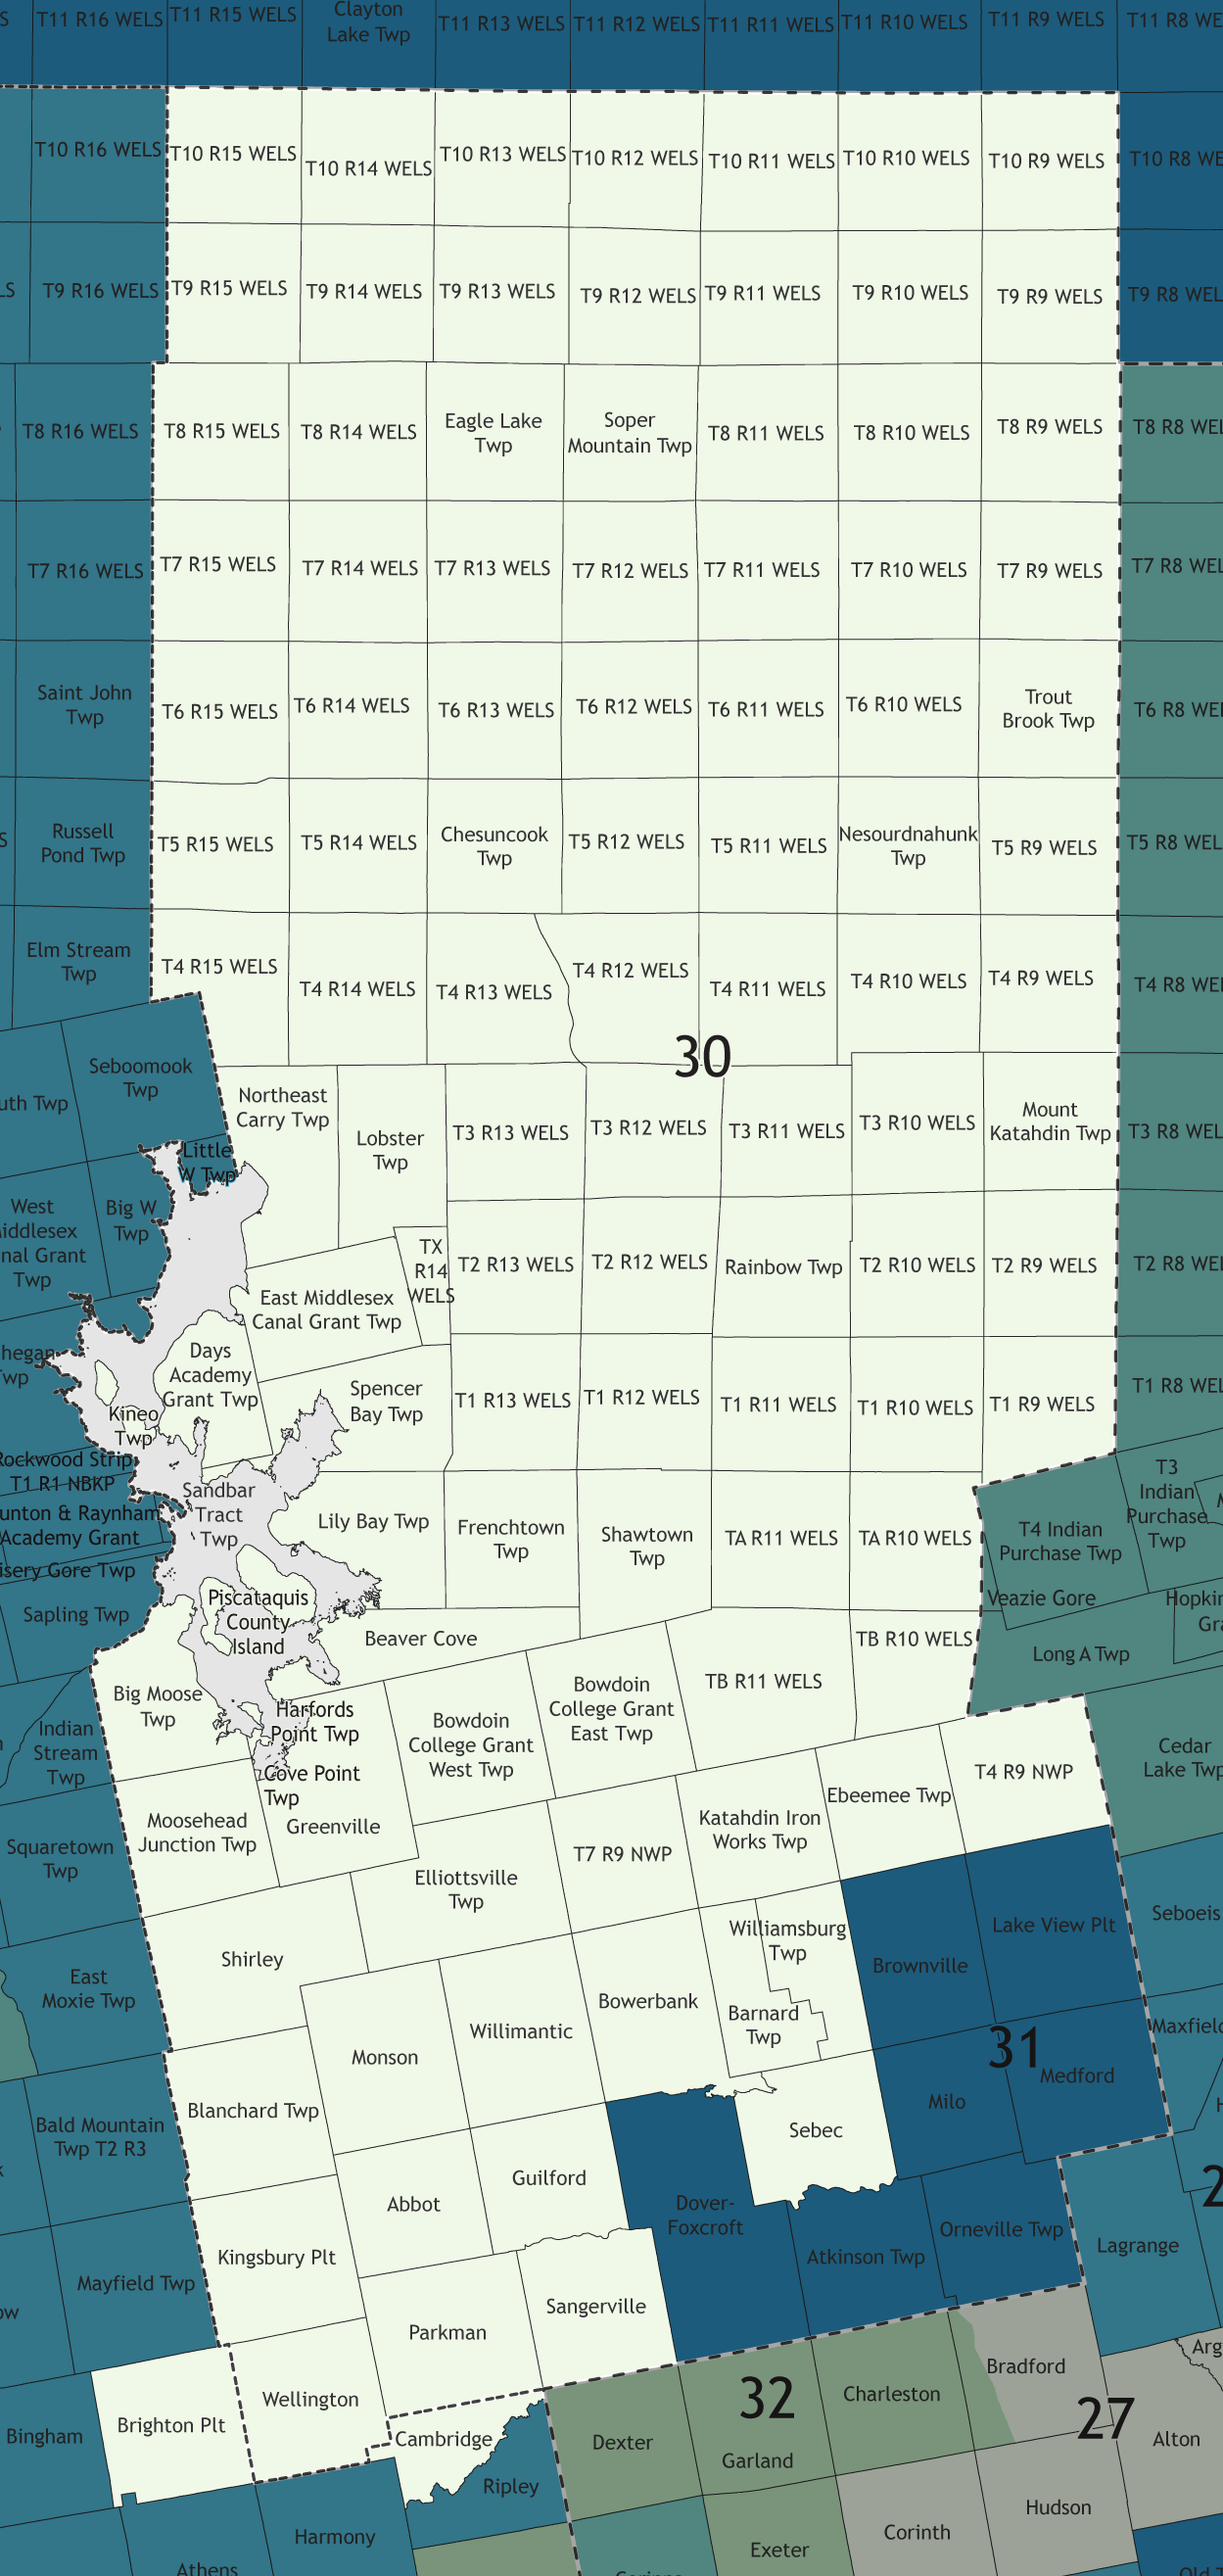
District 30[edit]
| Party | Candidate | Votes | % | |
|---|---|---|---|---|
| Democratic Party Primary Results | ||||
| Democratic | W. Louis Sidell, Jr. | 208 | 100.00% | |
| Total votes | 208 | 100.00% | ||
| Republican Party Primary Results | ||||
| Republican | James Lee White | 673 | 100.00% | |
| Total votes | 673 | 100.00% | ||
| Party | Candidate | Votes | % | |
|---|---|---|---|---|
| Republican | James Lee White | 3,008 | 66.30% | |
| Democratic | W. Louis Sidell, Jr. | 1,529 | 33.70% | |
| Total votes | 4,537 | 100.00% | ||
| Republican hold | ||||
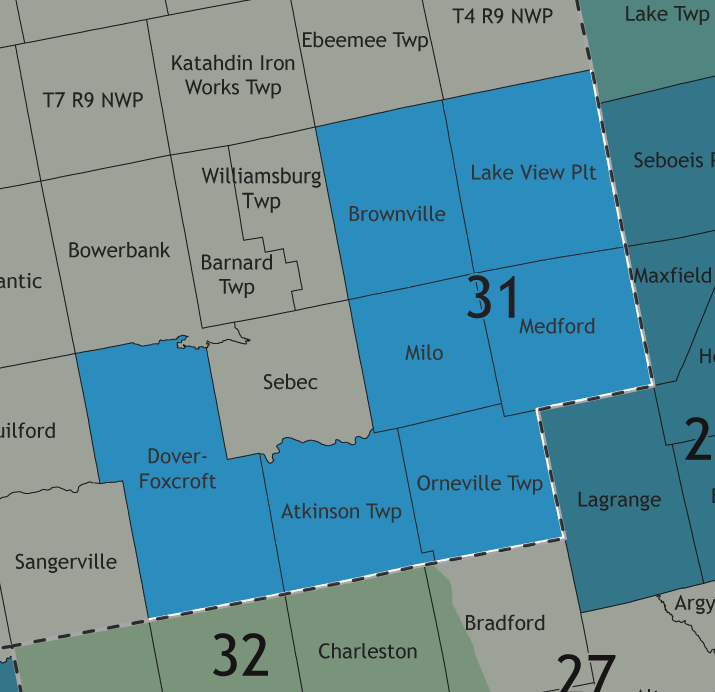
District 31[edit]
| Party | Candidate | Votes | % | |
|---|---|---|---|---|
| Democratic Party Primary Results | ||||
| Democratic | Richard A. Evans (incumbent) | 299 | 100.00% | |
| Total votes | 299 | 100.00% | ||
| Republican Party Primary Results | ||||
| Republican | Chad Richard Perkins | 479 | 100.00% | |
| Total votes | 479 | 100.00% | ||
| Party | Candidate | Votes | % | |
|---|---|---|---|---|
| Republican | Chad Richard Perkins | 2,108 | 54.58% | |
| Democratic | Richard A. Evans (incumbent) | 1,754 | 45.42% | |
| Total votes | 3,862 | 100.00% | ||
| Republican gain from Democratic | ||||
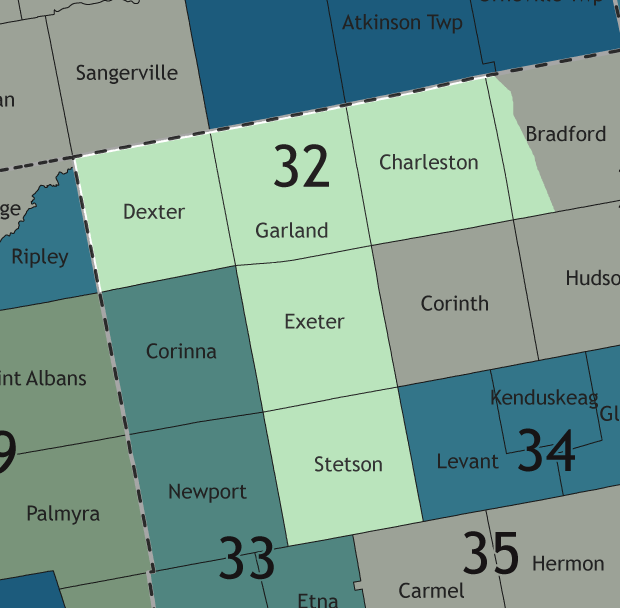
District 32[edit]
| Party | Candidate | Votes | % | |
|---|---|---|---|---|
| Republican Party Primary Results | ||||
| Republican | Steven D. Foster (incumbent) | 498 | 100.00% | |
| Total votes | 498 | 100.00% | ||
| Party | Candidate | Votes | % | |
|---|---|---|---|---|
| Republican | Steven D. Foster (incumbent) | 3,195 | 100.00% | |
| Total votes | 3,195 | 100.00% | ||
| Republican hold | ||||
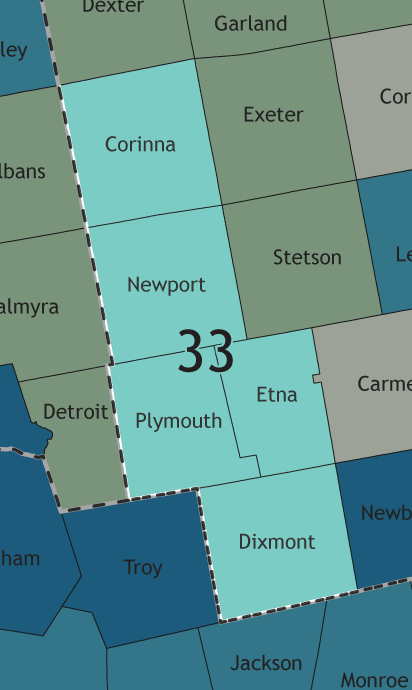
District 33[edit]
| Party | Candidate | Votes | % | |
|---|---|---|---|---|
| Democratic Party Primary Results | ||||
| Democratic | Donovan E. Todd III | 183 | 100.00% | |
| Total votes | 183 | 100.00% | ||
| Republican Party Primary Results | ||||
| Republican | Danny E. Costain (incumbent) | 515 | 100.00% | |
| Total votes | 515 | 100.00% | ||
| Party | Candidate | Votes | % | |
|---|---|---|---|---|
| Republican | Danny E. Costain (incumbent) | 2,989 | 71.68% | |
| Democratic | Donovan E. Todd III | 1,181 | 28.32% | |
| Total votes | 4,170 | 100.00% | ||
| Republican hold | ||||
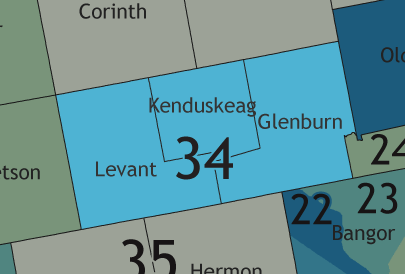
District 34[edit]
| Party | Candidate | Votes | % | |
|---|---|---|---|---|
| Democratic Party Primary Results | ||||
| Democratic | Frank Lawrence Roma | 121 | 100.00% | |
| Total votes | 121 | 100.00% | ||
| Republican Party Primary Results | ||||
| Republican | Abigail W. Griffin (incumbent) | 513 | 100.00% | |
| Total votes | 513 | 100.00% | ||
| Party | Candidate | Votes | % | |
|---|---|---|---|---|
| Republican | Abigail W. Griffin (incumbent) | 2,622 | 61.65% | |
| Democratic | Frank Lawrence Roma | 1,394 | 32.78% | |
| Independent | Joshua James Pietrowicz[k] | 237 | 5.57% | |
| Total votes | 4,253 | 100.00% | ||
| Republican hold | ||||
District 35[edit]
| Party | Candidate | Votes | % | |
|---|---|---|---|---|
| Democratic Party Primary Results | ||||
| Democratic | Candace T. Augustine[l] | 255 | 100.00% | |
| Total votes | 255 | 100.00% | ||
| Republican Party Primary Results | ||||
| Republican | James E. Thorne (incumbent) | 732 | 100.00% | |
| Total votes | 732 | 100.00% | ||
| Party | Candidate | Votes | % | |
|---|---|---|---|---|
| Republican | James E. Thorne (incumbent) | 3,871 | 100.00% | |
| Total votes | 3,871 | 100.00% | ||
| Republican hold | ||||
District 36[edit]
| Party | Candidate | Votes | % | |
|---|---|---|---|---|
| Democratic Party Primary Results | ||||
| Democratic | Kristen M. Card | 292 | 100.00% | |
| Total votes | 292 | 100.00% | ||
| Republican Party Primary Results | ||||
| Republican | David G. Haggan (incumbent) | 539 | 100.00% | |
| Total votes | 539 | 100.00% | ||
| Party | Candidate | Votes | % | |
|---|---|---|---|---|
| Republican | David G. Haggan (incumbent) | 2,930 | 59.69% | |
| Democratic | Kristen M. Card | 1,979 | 40.31% | |
| Total votes | 4,909 | 100.00% | ||
| Republican hold | ||||
District 37[edit]
| Party | Candidate | Votes | % | |
|---|---|---|---|---|
| Democratic Party Primary Results | ||||
| Democratic | Margaret D. English-Flanagan | 403 | 100.00% | |
| Total votes | 403 | 100.00% | ||
| Republican Party Primary Results | ||||
| Republican | Reagan L. Paul | 515 | 73.99% | |
| Republican | Kevin J. Kelley | 181 | 26.01% | |
| Total votes | 696 | 100.00% | ||
| Party | Candidate | Votes | % | |
|---|---|---|---|---|
| Republican | Reagan L. Paul | 2,619 | 52.21% | |
| Democratic | Margaret D. English-Flanagan | 2,397 | 47.79% | |
| Total votes | 5,016 | 100.00% | ||
| Republican gain from Democratic | ||||
District 38[edit]
| Party | Candidate | Votes | % | |
|---|---|---|---|---|
| Democratic Party Primary Results | ||||
| Democratic | Robyn M. Stanicki | 247 | 100.00% | |
| Total votes | 247 | 100.00% | ||
| Republican Party Primary Results | ||||
| Republican | Benjamin C. Hymes | 293 | 54.36% | |
| Republican | Jesse J. Waryck | 246 | 45.64% | |
| Total votes | 539 | 100.00% | ||
| Green Party Primary Results | ||||
| Green | Heather Elizabeth Garrold | 37 | 100.00% | |
| Total votes | 37 | 100.00% | ||
| Party | Candidate | Votes | % | |
|---|---|---|---|---|
| Republican | Benjamin C. Hymes | 2,155 | 51.11% | |
| Democratic | Robyn M. Stanicki | 1,475 | 34.99% | |
| Green | Heather Elizabeth Garrold | 586 | 13.90% | |
| Total votes | 4,216 | 100.00% | ||
| Republican hold | ||||
District 39[edit]
| Party | Candidate | Votes | % | |
|---|---|---|---|---|
| Democratic Party Primary Results | ||||
| Democratic | Janice S. Dodge (incumbent) | 544 | 100.00% | |
| Total votes | 544 | 100.00% | ||
| Republican Party Primary Results | ||||
| Republican | Stephen J. Hemenway | 325 | 100.00% | |
| Total votes | 325 | 100.00% | ||
| Party | Candidate | Votes | % | |
|---|---|---|---|---|
| Democratic | Janice S. Dodge (incumbent) | 3,442 | 68.65% | |
| Republican | Stephen J. Hemenway | 1,572 | 31.35% | |
| Total votes | 5,014 | 100.00% | ||
| Democratic hold | ||||
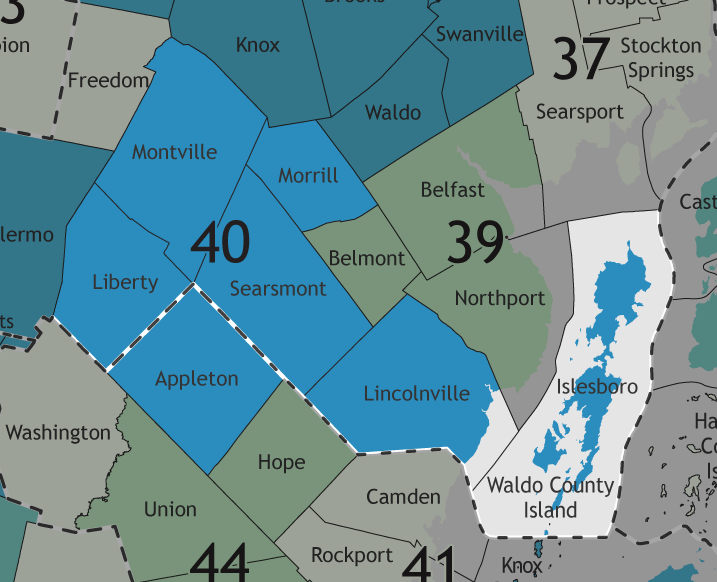
District 40[edit]
| Party | Candidate | Votes | % | |
|---|---|---|---|---|
| Democratic Party Primary Results | ||||
| Democratic | Stanley Paige Zeigler, Jr. (incumbent) | 642 | 100.00% | |
| Total votes | 642 | 100.00% | ||
| Republican Party Primary Results | ||||
| Republican | Tricia M. Harrington[m] | 436 | 100.00% | |
| Total votes | 436 | 100.00% | ||
| Party | Candidate | Votes | % | |
|---|---|---|---|---|
| Democratic | Stanley Paige Zeigler, Jr. (incumbent) | 2,950 | 58.72% | |
| Republican | Joseph M. McLaughlin | 2,074 | 41.28% | |
| Total votes | 5,024 | 100.00% | ||
| Democratic hold | ||||
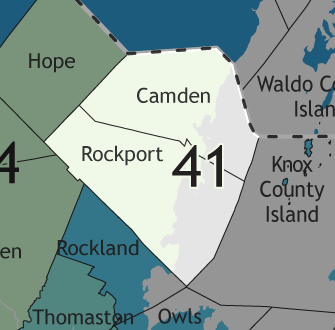
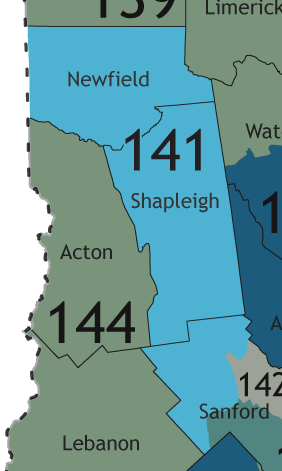
District 41[edit]
| Party | Candidate | Votes | % | |
|---|---|---|---|---|
| Democratic Party Primary Results | ||||
| Democratic | Victoria W. Doudera (incumbent) | 1,276 | 100.00% | |
| Total votes | 1,276 | 100.00% | ||
| Republican Party Primary Results | ||||
| Republican | Susan Lee Butterworth | 333 | 100.00% | |
| Total votes | 333 | 100.00% | ||
| Party | Candidate | Votes | % | |
|---|---|---|---|---|
| Democratic | Victoria W. Doudera (incumbent) | 4,083 | 75.46% | |
| Republican | Susan Lee Butterworth | 1,328 | 24.54% | |
| Total votes | 5,411 | 100.00% | ||
| Democratic hold | ||||
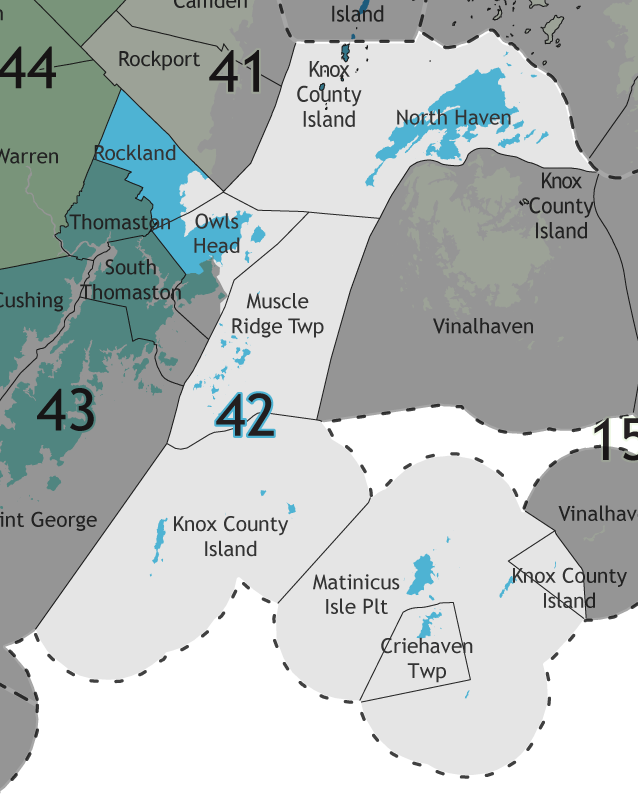
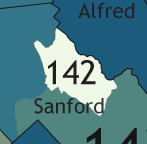
District 42[edit]
| Party | Candidate | Votes | % | |
|---|---|---|---|---|
| Democratic Party Primary Results | ||||
| Democratic | Valli D. Geiger (incumbent) | 404 | 100.00% | |
| Total votes | 404 | 100.00% | ||
| Republican Party Primary Results | ||||
| Republican | Roger V. Tranfaglia | 198 | 100.00% | |
| Total votes | 198 | 100.00% | ||
| Party | Candidate | Votes | % | |
|---|---|---|---|---|
| Democratic | Valli D. Geiger (incumbent) | 2,784 | 65.54% | |
| Republican | Roger V. Tranfaglia | 1,464 | 34.46% | |
| Total votes | 4,248 | 100.00% | ||
| Democratic hold | ||||
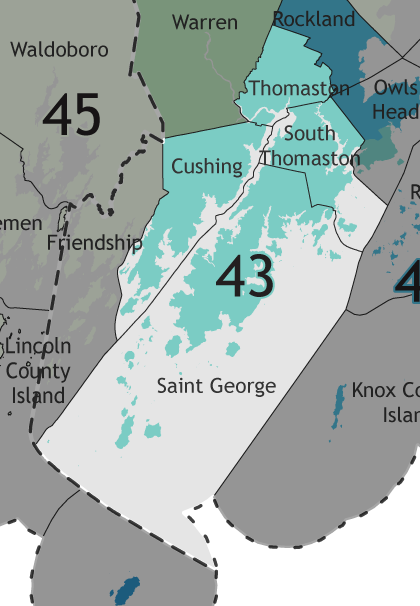
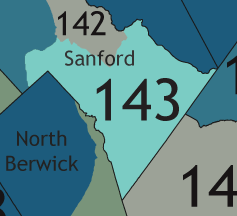
District 43[edit]
| Party | Candidate | Votes | % | |
|---|---|---|---|---|
| Democratic Party Primary Results | ||||
| Democratic | Ann Higgins Matlack (incumbent) | 647 | 100.00% | |
| Total votes | 647 | 100.00% | ||
| Republican Party Primary Results | ||||
| Republican | Heather Anne Sprague | 353 | 100.00% | |
| Total votes | 353 | 100.00% | ||
| Party | Candidate | Votes | % | |
|---|---|---|---|---|
| Democratic | Ann Higgins Matlack (incumbent) | 2,927 | 59.91% | |
| Republican | Heather Anne Sprague | 1,959 | 40.09% | |
| Total votes | 4,886 | 100.00% | ||
| Democratic hold | ||||
District 44[edit]
| Party | Candidate | Votes | % | |
|---|---|---|---|---|
| Republican Party Primary Results | ||||
| Republican | Crystal L. Robinson | 544 | 100.00% | |
| Total votes | 544 | 100.00% | ||
| Party | Candidate | Votes | % | |
|---|---|---|---|---|
| Independent | William D. Pluecker (incumbent)[n] | 2,372 | 54.04% | |
| Republican | Crystal L. Robinson | 2,017 | 45.96% | |
| Total votes | 4,389 | 100.00% | ||
| Independent hold | ||||
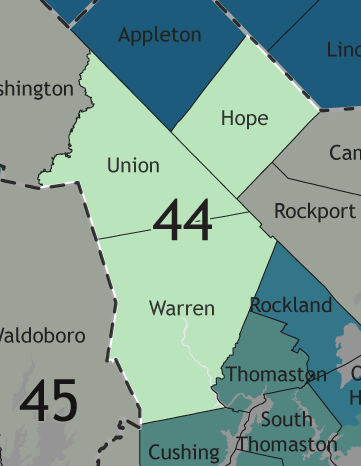
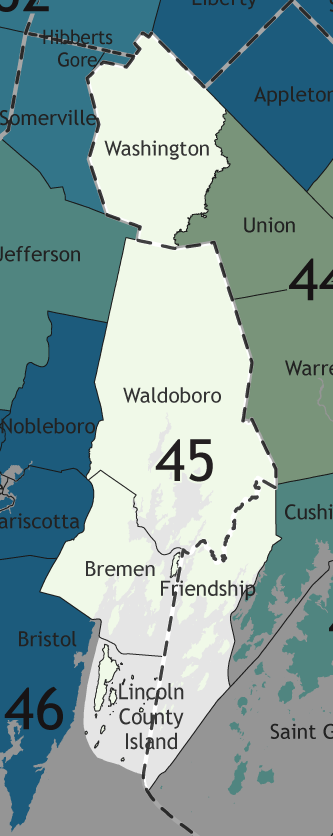
District 45[edit]
| Party | Candidate | Votes | % | |
|---|---|---|---|---|
| Democratic Party Primary Results | ||||
| Democratic | Clinton E. Collamore | 590 | 100.00% | |
| Total votes | 590 | 100.00% | ||
| Republican Party Primary Results | ||||
| Republican | Lynn J. Madison | 575 | 100.00% | |
| Total votes | 575 | 100.00% | ||
| Party | Candidate | Votes | % | |
|---|---|---|---|---|
| Democratic | Clinton E. Collamore | 2,502 | 53.23% | |
| Republican | Lynn J. Madison | 2,198 | 46.77% | |
| Total votes | 4,700 | 100.00% | ||
| Democratic gain from Independent | ||||
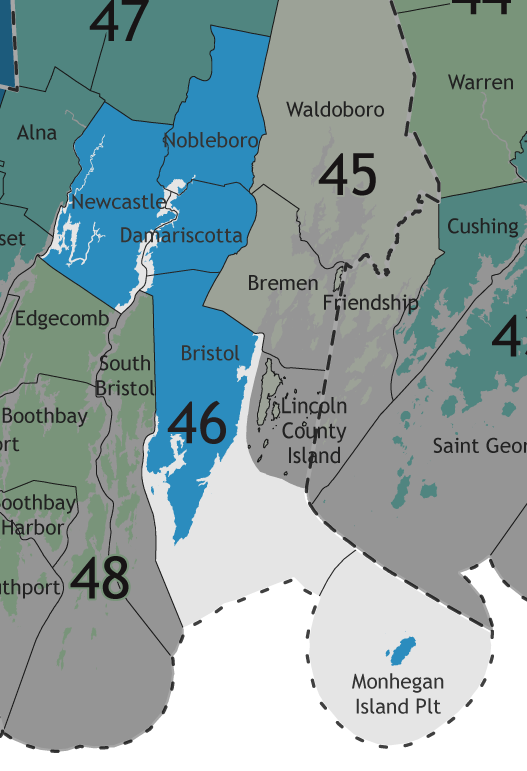
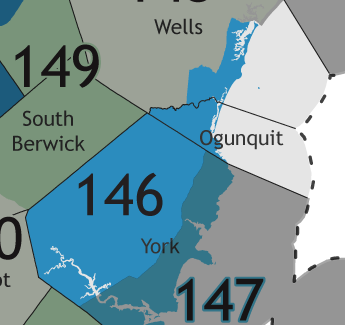
District 46[edit]
| Party | Candidate | Votes | % | |
|---|---|---|---|---|
| Democratic Party Primary Results | ||||
| Democratic | Lydia V. Crafts (incumbent) | 957 | 100.00% | |
| Total votes | 957 | 100.00% | ||
| Republican Party Primary Results | ||||
| Republican | Merle James Parise II | 321 | 100.00% | |
| Total votes | 321 | 100.00% | ||
| Party | Candidate | Votes | % | |
|---|---|---|---|---|
| Democratic | Lydia V. Crafts (incumbent) | 3,693 | 65.01% | |
| Republican | Merle James Parise II | 1,988 | 34.99% | |
| Total votes | 5,681 | 100.00% | ||
| Democratic hold | ||||
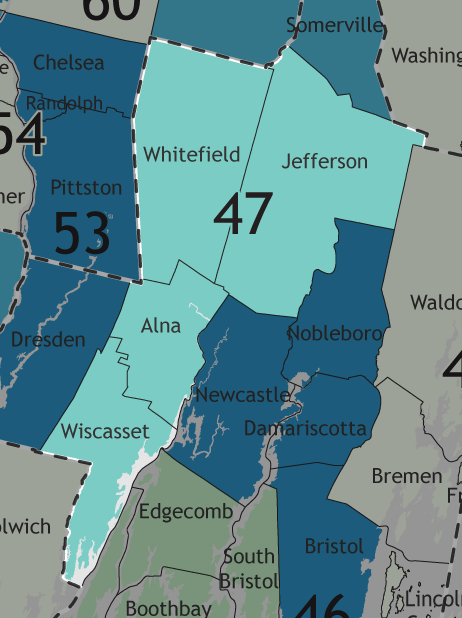
District 47[edit]
| Party | Candidate | Votes | % | |
|---|---|---|---|---|
| Republican Party Primary Results | ||||
| Republican | Edward J. Polewarczyk | 508 | 100.00% | |
| Total votes | 508 | 100.00% | ||
| Party | Candidate | Votes | % | |
|---|---|---|---|---|
| Republican | Edward J. Polewarczyk | 2,055 | 40.63% | |
| Independent | Evan C. Goodkowsky | 1,773 | 35.05% | |
| Independent | Leslie T. Fossel | 1,230 | 24.32% | |
| Total votes | 5,058 | 100.00% | ||
| Republican hold | ||||
District 48[edit]
| Party | Candidate | Votes | % | |
|---|---|---|---|---|
| Democratic Party Primary Results | ||||
| Democratic | Holly B. Stover (incumbent) | 1,033 | 96.18% | |
| Democratic | Thomas A. Moroney | 41 | 3.82% | |
| Total votes | 1,074 | 100.00% | ||
| Republican Party Primary Results | ||||
| Republican | Tricia L. Warren | 458 | 100.00% | |
| Total votes | 458 | 100.00% | ||
| Party | Candidate | Votes | % | |
|---|---|---|---|---|
| Democratic | Holly B. Stover (incumbent) | 3,570 | 63.46% | |
| Republican | Tricia L. Warren | 2,056 | 36.54% | |
| Total votes | 5,626 | 100.00% | ||
| Democratic hold | ||||
District 49[edit]
| Party | Candidate | Votes | % | |
|---|---|---|---|---|
| Democratic Party Primary Results | ||||
| Democratic | Allison L. Hepler (incumbent) | 577 | 100.00% | |
| Total votes | 577 | 100.00% | ||
| Republican Party Primary Results | ||||
| Republican | Richard Henry Tetrev[o] | 410 | 100.00% | |
| Total votes | 410 | 100.00% | ||
| Party | Candidate | Votes | % | |
|---|---|---|---|---|
| Democratic | Allison L. Hepler (incumbent) | 3,284 | 57.64% | |
| Republican | Kelly James | 2,413 | 42.36% | |
| Total votes | 5,697 | 100.00% | ||
| Democratic hold | ||||
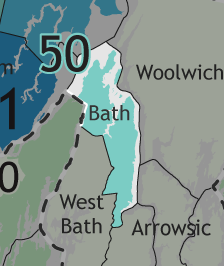
District 50[edit]
| Party | Candidate | Votes | % | |
|---|---|---|---|---|
| Democratic Party Primary Results | ||||
| Democratic | Sean C. Paulhus (incumbent) | 415 | 100.00% | |
| Total votes | 415 | 100.00% | ||
| Republican Party Primary Results | ||||
| Republican | Jason E. Desjardins | 162 | 100.00% | |
| Total votes | 162 | 100.00% | ||
| Party | Candidate | Votes | % | |
|---|---|---|---|---|
| Democratic | Sean C. Paulhus (incumbent) | 2,993 | 70.57% | |
| Republican | Jason E. Desjardins | 1,248 | 29.43% | |
| Total votes | 4,241 | 100.00% | ||
| Democratic hold | ||||
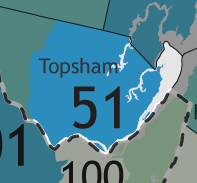
District 51[edit]
| Party | Candidate | Votes | % | |
|---|---|---|---|---|
| Democratic Party Primary Results | ||||
| Democratic | Rebecca L. Jauch | 481 | 100.00% | |
| Total votes | 481 | 100.00% | ||
| Republican Party Primary Results | ||||
| Republican | Linda L. Baker | 260 | 100.00% | |
| Total votes | 260 | 100.00% | ||
| Party | Candidate | Votes | % | |
|---|---|---|---|---|
| Democratic | Rebecca L. Jauch | 3,090 | 59.08% | |
| Republican | Linda L. Baker | 2,140 | 40.92% | |
| Total votes | 5,230 | 100.00% | ||
| Democratic hold | ||||
District 52[edit]
| Party | Candidate | Votes | % | |
|---|---|---|---|---|
| Democratic Party Primary Results | ||||
| Democratic | Seth A. Berry (incumbent)[p] | 379 | 100.00% | |
| Total votes | 379 | 100.00% | ||
| Party | Candidate | Votes | % | ||
|---|---|---|---|---|---|
| Democratic | Sally Jeane Cluchey | 2,504 | 56.38% | ||
| Independent | Peter A. Lewis[d] | 1,937 | 43.62% | ||
| Total votes | 4,441 | 100.00% | |||
| Democratic win (new seat) | |||||
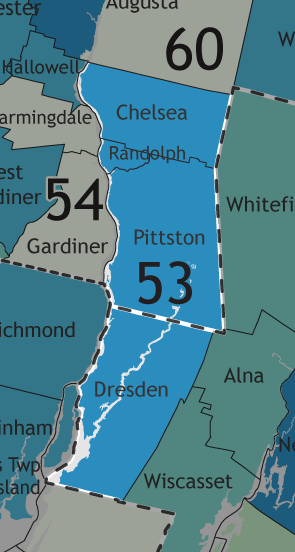
District 53[edit]
| Party | Candidate | Votes | % | |
|---|---|---|---|---|
| Democratic Party Primary Results | ||||
| Democratic | Jane L. Beckwith | 317 | 100.00% | |
| Total votes | 317 | 100.00% | ||
| Republican Party Primary Results | ||||
| Republican | Michael Lemelin (incumbent) | 427 | 100.00% | |
| Total votes | 427 | 100.00% | ||
| Party | Candidate | Votes | % | |
|---|---|---|---|---|
| Republican | Michael Lemelin (incumbent) | 2,672 | 57.61% | |
| Democratic | Jane L. Beckwith | 1,966 | 42.39% | |
| Total votes | 4,638 | 100.00% | ||
| Republican hold | ||||
District 54[edit]
| Party | Candidate | Votes | % | |
|---|---|---|---|---|
| Democratic Party Primary Results | ||||
| Democratic | Karen L. Montell | 448 | 100.00% | |
| Total votes | 448 | 100.00% | ||
| Republican Party Primary Results | ||||
| Republican | Charles J. Bussell | 378 | 100.00% | |
| Total votes | 378 | 100.00% | ||
| Party | Candidate | Votes | % | |
|---|---|---|---|---|
| Democratic | Karen L. Montell | 2,142 | 49.87% | |
| Republican | Charles J. Bussell | 1,987 | 46.26% | |
| Independent | Nicolas Delli Paoli | 166 | 3.86% | |
| Total votes | 4,295 | 100.00% | ||
| Democratic hold | ||||
District 55[edit]
| Party | Candidate | Votes | % | |
|---|---|---|---|---|
| Democratic Party Primary Results | ||||
| Democratic | Daniel Joseph Shagoury | 523 | 56.18% | |
| Democratic | Patrick B. Wynne | 408 | 43.82% | |
| Total votes | 931 | 100.00% | ||
| Republican Party Primary Results | ||||
| Republican | Phillip Ryan Wiseman | 469 | 100.00% | |
| Total votes | 469 | 100.00% | ||
| Party | Candidate | Votes | % | |
|---|---|---|---|---|
| Democratic | Daniel Joseph Shagoury | 2,781 | 54.91% | |
| Republican | Phillip Ryan Wiseman | 2,284 | 45.09% | |
| Total votes | 5,065 | 100.00% | ||
| Democratic hold | ||||
District 56[edit]
| Party | Candidate | Votes | % | |
|---|---|---|---|---|
| Republican Party Primary Results | ||||
| Republican | Randall Adam Greenwood (incumbent) | 529 | 100.00% | |
| Total votes | 529 | 100.00% | ||
| Party | Candidate | Votes | % | |
|---|---|---|---|---|
| Republican | Randall Adam Greenwood (incumbent) | 2,449 | 50.93% | |
| Independent | Kent Ackley[q] | 2,360 | 49.07% | |
| Total votes | 4,809 | 100.00% | ||
| Republican hold | ||||
District 57[edit]
| Party | Candidate | Votes | % | |
|---|---|---|---|---|
| Democratic Party Primary Results | ||||
| Democratic | Tavis Rock Hasenfus (incumbent) | 620 | 100.00% | |
| Total votes | 620 | 100.00% | ||
| Republican Party Primary Results | ||||
| Republican | Corey S. Wilson | 540 | 100.00% | |
| Total votes | 540 | 100.00% | ||
| Party | Candidate | Votes | % | |
|---|---|---|---|---|
| Democratic | Tavis Rock Hasenfus (incumbent) | 2,639 | 53.90% | |
| Republican | Corey S. Wilson | 2,257 | 46.10% | |
| Total votes | 4,896 | 100.00% | ||
| Democratic hold | ||||
District 58[edit]
| Party | Candidate | Votes | % | |
|---|---|---|---|---|
| Democratic Party Primary Results | ||||
| Democratic | Robert Smith Neal | 555 | 100.00% | |
| Total votes | 555 | 100.00% | ||
| Republican Party Primary Results | ||||
| Republican | Daniel J. Newman (incumbent) | 622 | 100.00% | |
| Total votes | 622 | 100.00% | ||
| Party | Candidate | Votes | % | |
|---|---|---|---|---|
| Republican | Daniel J. Newman (incumbent) | 2,874 | 52.71% | |
| Democratic | Robert Smith Neal | 2,578 | 47.29% | |
| Total votes | 5,452 | 100.00% | ||
| Republican hold | ||||
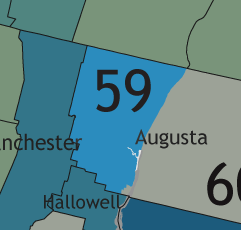
District 59[edit]
| Party | Candidate | Votes | % | |
|---|---|---|---|---|
| Democratic Party Primary Results | ||||
| Democratic | Raegan French LaRochelle (incumbent) | 350 | 100.00% | |
| Total votes | 350 | 100.00% | ||
| Republican Party Primary Results | ||||
| Republican | James E. Orr | 332 | 62.76% | |
| Republican | Michael Raymond Michaud | 197 | 37.24% | |
| Total votes | 529 | 100.00% | ||
| Party | Candidate | Votes | % | |
|---|---|---|---|---|
| Democratic | Raegan French LaRochelle (incumbent) | 2,418 | 60.53% | |
| Republican | James E. Orr | 1,577 | 39.47% | |
| Total votes | 3,995 | 100.00% | ||
| Democratic hold | ||||
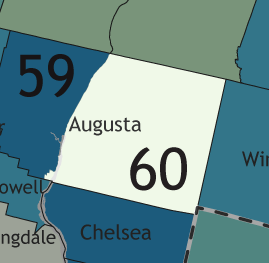
District 60[edit]
| Party | Candidate | Votes | % | |
|---|---|---|---|---|
| Democratic Party Primary Results | ||||
| Democratic | William R. Bridgeo | 272 | 100.00% | |
| Total votes | 272 | 100.00% | ||
| Republican Party Primary Results | ||||
| Republican | William L. Clardy | 238 | 100.00% | |
| Total votes | 238 | 100.00% | ||
| Party | Candidate | Votes | % | ||
|---|---|---|---|---|---|
| Democratic | William R. Bridgeo | 2,354 | 59.70% | ||
| Republican | William L. Clardy | 1,589 | 40.30% | ||
| Total votes | 3,943 | 100.00% | |||
| Democratic win (new seat) | |||||
District 61[edit]
| Party | Candidate | Votes | % | |
|---|---|---|---|---|
| Democratic Party Primary Results | ||||
| Democratic | Amy J. Davidoff | 152 | 100.00% | |
| Total votes | 152 | 100.00% | ||
| Republican Party Primary Results | ||||
| Republican | Richard T. Bradstreet (incumbent) | 446 | 100.00% | |
| Total votes | 446 | 100.00% | ||
| Party | Candidate | Votes | % | |
|---|---|---|---|---|
| Republican | Richard T. Bradstreet (incumbent) | 2,838 | 61.95% | |
| Democratic | Amy J. Davidoff | 1,743 | 38.05% | |
| Total votes | 4,581 | 100.00% | ||
| Republican hold | ||||
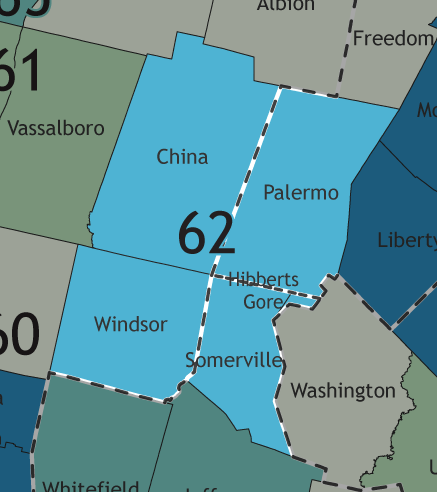
District 62[edit]
| Party | Candidate | Votes | % | |
|---|---|---|---|---|
| Democratic Party Primary Results | ||||
| Democratic | Pamela J. Swift | 357 | 100.00% | |
| Total votes | 357 | 100.00% | ||
| Republican Party Primary Results | ||||
| Republican | Katrina J. Smith | 524 | 62.38% | |
| Republican | Jennifer V. Tuminaro | 316 | 37.62% | |
| Total votes | 840 | 100.00% | ||
| Party | Candidate | Votes | % | |
|---|---|---|---|---|
| Republican | Katrina J. Smith | 2,666 | 57.84% | |
| Democratic | Pamela J. Swift | 1,505 | 32.65% | |
| Independent | Lindsey D. Harwath | 438 | 9.50% | |
| Total votes | 4,609 | 100.00% | ||
| Republican hold | ||||
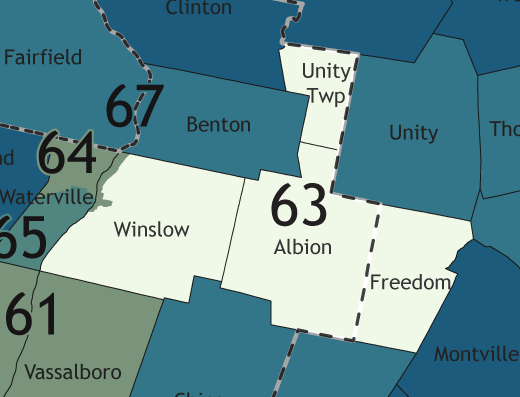
District 63[edit]
| Party | Candidate | Votes | % | |
|---|---|---|---|---|
| Democratic Party Primary Results | ||||
| Democratic | Phillip Bloomstein[r] | 183 | 100.00% | |
| Total votes | 183 | 100.00% | ||
| Republican Party Primary Results | ||||
| Republican | Scott Wynn Cyrway | 654 | 100.00% | |
| Total votes | 654 | 100.00% | ||
| Party | Candidate | Votes | % | |
|---|---|---|---|---|
| Republican | Scott Wynn Cyrway | 3,728 | 100.00% | |
| Total votes | 3,728 | 100.00% | ||
| Republican hold | ||||
District 64[edit]
| Party | Candidate | Votes | % | |
|---|---|---|---|---|
| Democratic Party Primary Results | ||||
| Democratic | Colleen M. Madigan (incumbent) | 182 | 100.00% | |
| Total votes | 182 | 100.00% | ||
| Republican Party Primary Results | ||||
| Republican | Ruth Ann Malcolm | 156 | 100.00% | |
| Total votes | 156 | 100.00% | ||
| Party | Candidate | Votes | % | |
|---|---|---|---|---|
| Democratic | Colleen M. Madigan (incumbent) | 2,230 | 69.10% | |
| Republican | Ruth Ann Malcolm | 997 | 30.90% | |
| Total votes | 3,227 | 100.00% | ||
| Democratic hold | ||||
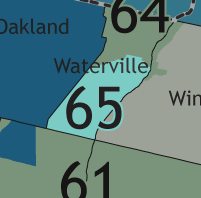
District 65[edit]
| Party | Candidate | Votes | % | |
|---|---|---|---|---|
| Democratic Party Primary Results | ||||
| Democratic | Bruce A. White (incumbent) | 237 | 100.00% | |
| Total votes | 237 | 100.00% | ||
| Republican Party Primary Results | ||||
| Republican | Tammy Brown | 211 | 100.00% | |
| Total votes | 211 | 100.00% | ||
| Party | Candidate | Votes | % | |
|---|---|---|---|---|
| Democratic | Bruce A. White (incumbent) | 2,055 | 67.27% | |
| Republican | Tammy Brown | 1,000 | 32.73% | |
| Total votes | 3,055 | 100.00% | ||
| Democratic hold | ||||
District 66[edit]
| Party | Candidate | Votes | % | |
|---|---|---|---|---|
| Democratic Party Primary Results | ||||
| Democratic | Alicia Barnes | 221 | 100.00% | |
| Total votes | 221 | 100.00% | ||
| Republican Party Primary Results | ||||
| Republican | Robert W. Nutting | 600 | 100.00% | |
| Total votes | 600 | 100.00% | ||
| Party | Candidate | Votes | % | |
|---|---|---|---|---|
| Republican | Robert W. Nutting | 2,671 | 60.13% | |
| Democratic | Alicia Barnes | 1,771 | 39.87% | |
| Total votes | 4,442 | 100.00% | ||
| Republican hold | ||||
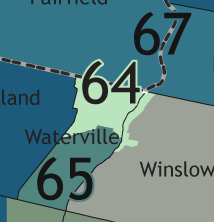
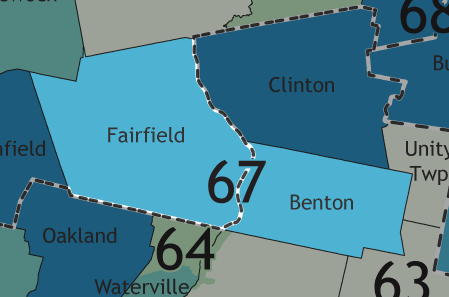
District 67[edit]
| Party | Candidate | Votes | % | |
|---|---|---|---|---|
| Democratic Party Primary Results | ||||
| Democratic | Robert Sezak | 264 | 100.00% | |
| Total votes | 264 | 100.00% | ||
| Republican Party Primary Results | ||||
| Republican | Shelley J. Rudnicki (incumbent) | 478 | 100.00% | |
| Total votes | 478 | 100.00% | ||
| Party | Candidate | Votes | % | |
|---|---|---|---|---|
| Republican | Shelley J. Rudnicki (incumbent) | 2,262 | 55.81% | |
| Democratic | Robert Sezak | 1,791 | 44.19% | |
| Total votes | 4,053 | 100.00% | ||
| Republican hold | ||||
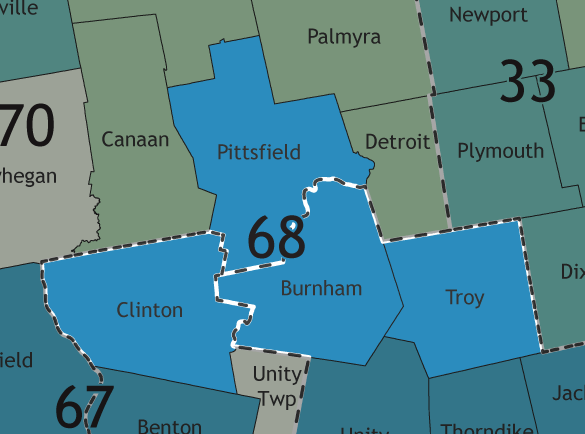
District 68[edit]
| Party | Candidate | Votes | % | |
|---|---|---|---|---|
| Democratic Party Primary Results | ||||
| Democratic | Stanley Byron Short, Jr. | 178 | 100.00% | |
| Total votes | 178 | 100.00% | ||
| Republican Party Primary Results | ||||
| Republican | Amanda Noelle Collamore (incumbent) | 437 | 100.00% | |
| Total votes | 437 | 100.00% | ||
| Party | Candidate | Votes | % | |
|---|---|---|---|---|
| Republican | Amanda Noelle Collamore (incumbent) | 2,366 | 58.22% | |
| Democratic | Stanley Byron Short, Jr. | 1,698 | 41.78% | |
| Total votes | 4,064 | 100.00% | ||
| Republican hold | ||||
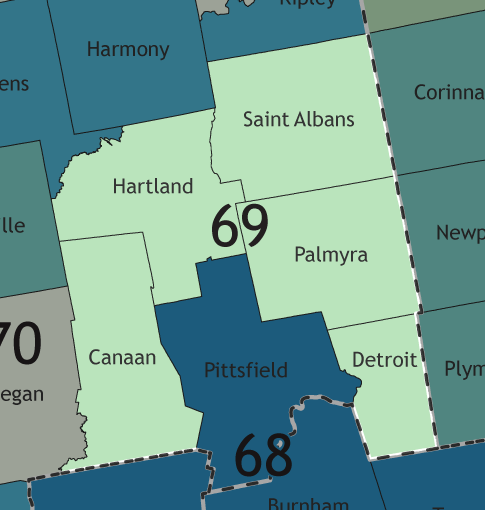
District 69[edit]
| Party | Candidate | Votes | % | |
|---|---|---|---|---|
| Democratic Party Primary Results | ||||
| Democratic | Stephen A. Hale | 141 | 100.00% | |
| Total votes | 141 | 100.00% | ||
| Republican Party Primary Results | ||||
| Republican | Dean A. Cray | 590 | 100.00% | |
| Total votes | 590 | 100.00% | ||
| Party | Candidate | Votes | % | |
|---|---|---|---|---|
| Republican | Dean A. Cray | 2,960 | 74.50% | |
| Democratic | Stephen A. Hale | 1,013 | 25.50% | |
| Total votes | 3,973 | 100.00% | ||
| Republican hold | ||||
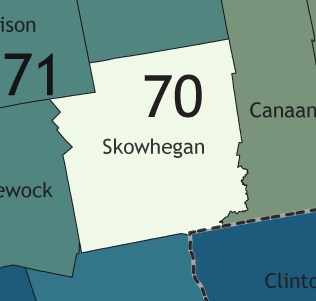
District 70[edit]
| Party | Candidate | Votes | % | |
|---|---|---|---|---|
| Democratic Party Primary Results | ||||
| Democratic | Iver W. Lofving | 300 | 100.00% | |
| Total votes | 300 | 100.00% | ||
| Republican Party Primary Results | ||||
| Republican | Jennifer Lynn Poirier (incumbent) | 408 | 100.00% | |
| Total votes | 408 | 100.00% | ||
| Party | Candidate | Votes | % | |
|---|---|---|---|---|
| Republican | Jennifer Lynn Poirier (incumbent) | 2,007 | 60.49% | |
| Democratic | Iver W. Lofving | 1,311 | 39.51% | |
| Total votes | 3,318 | 100.00% | ||
| Republican hold | ||||
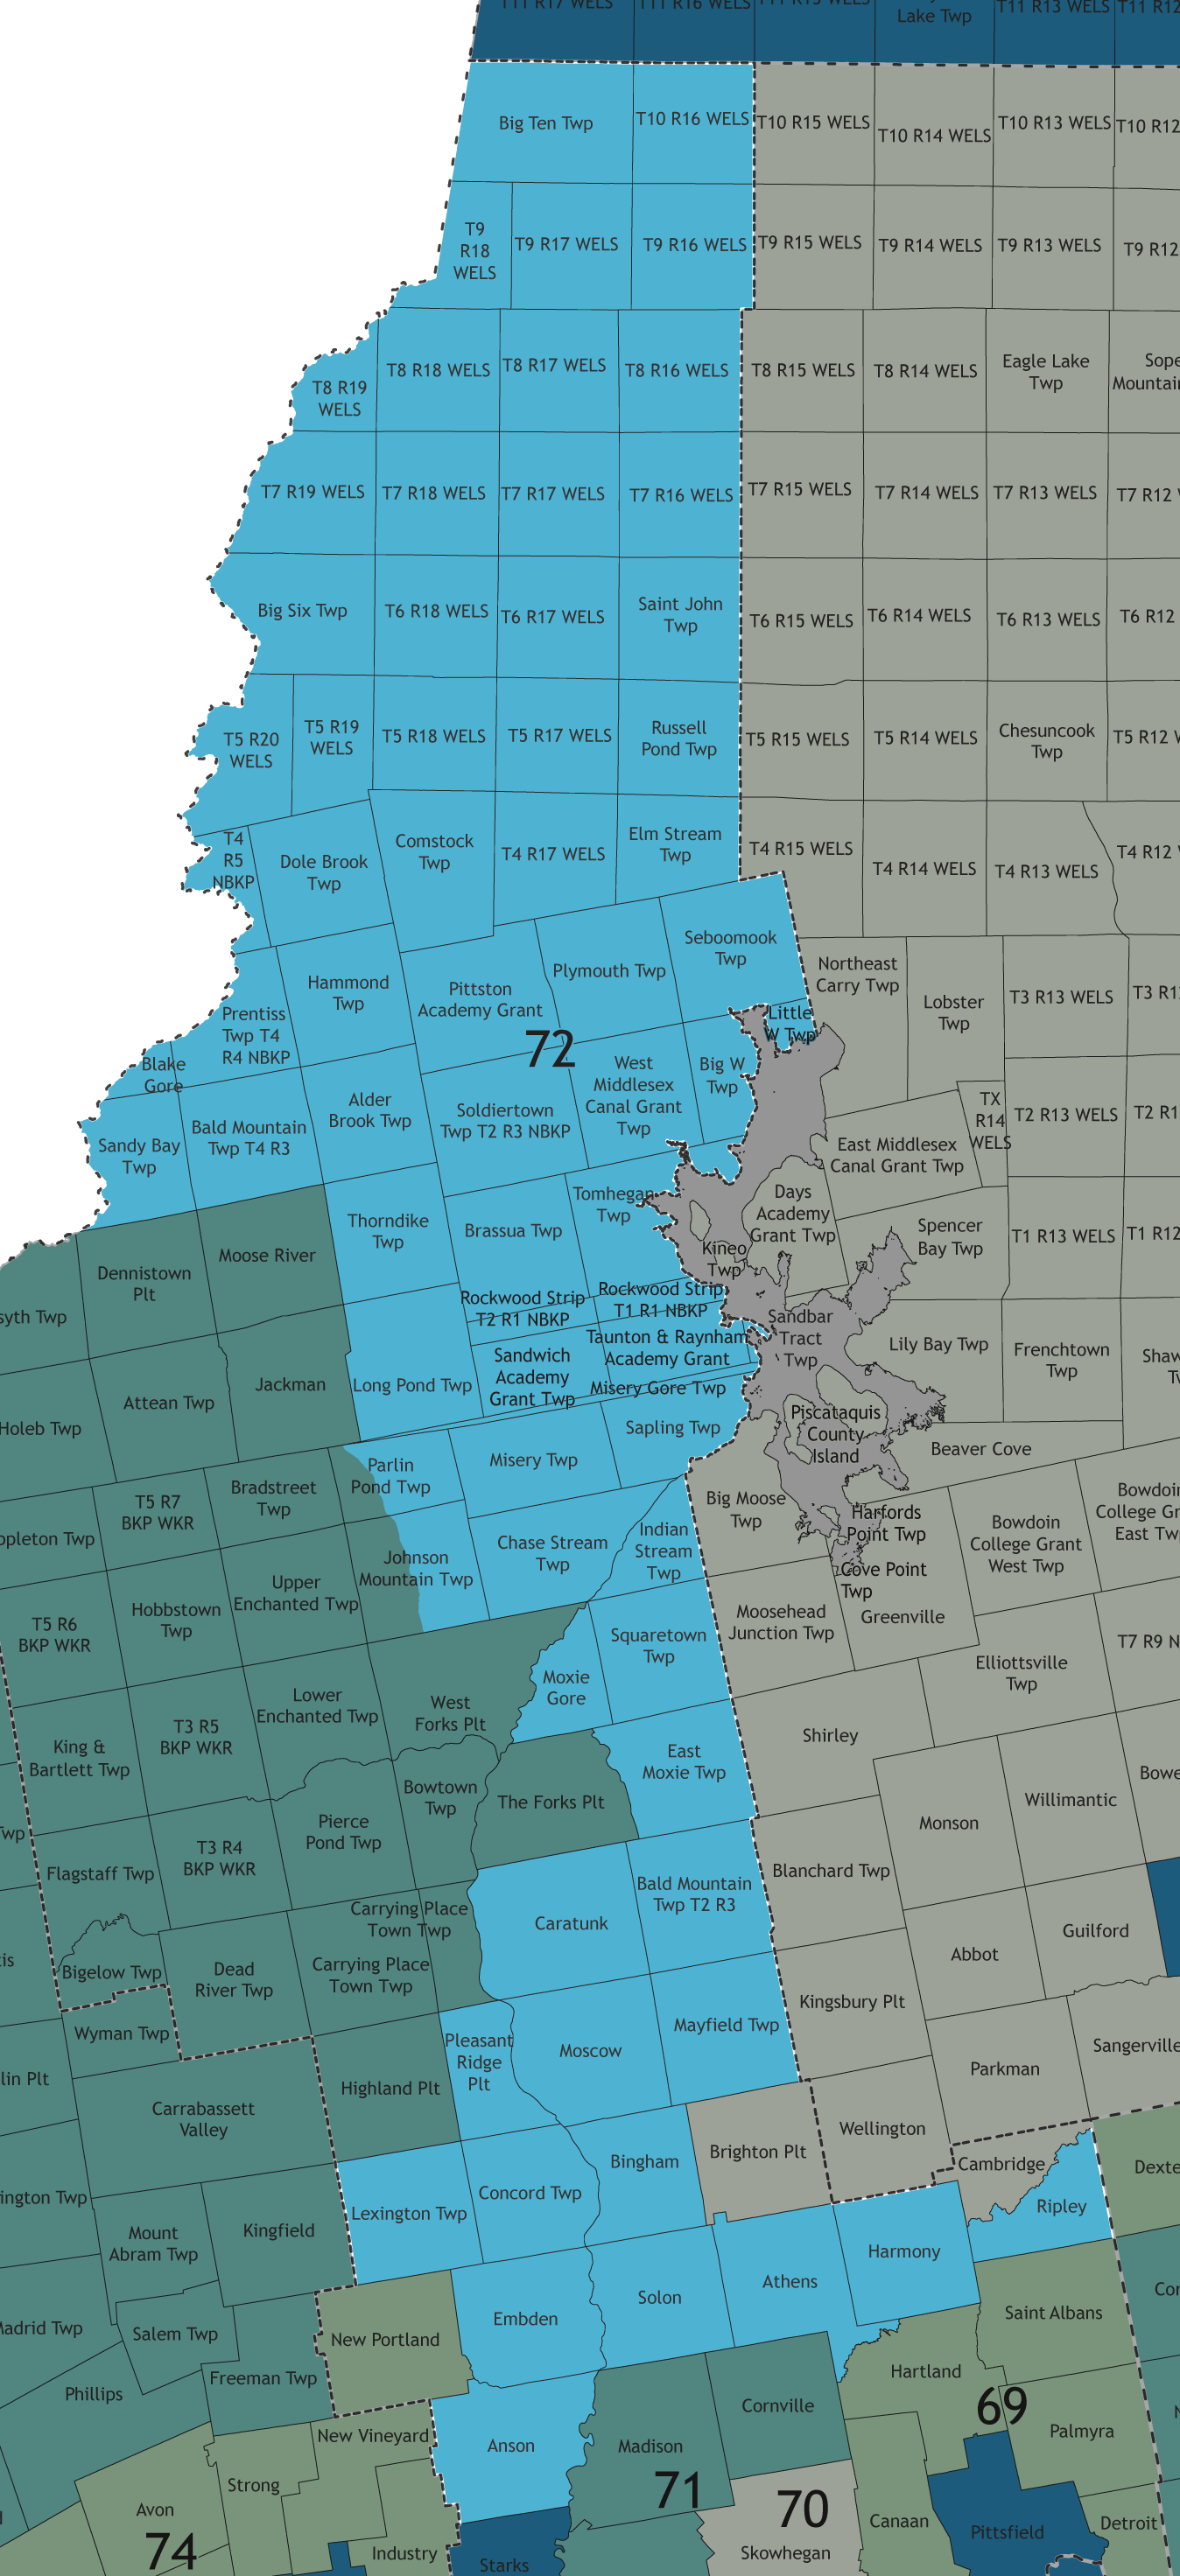
District 71[edit]
| Party | Candidate | Votes | % | |
|---|---|---|---|---|
| Democratic Party Primary Results | ||||
| Democratic | Allison Mary Perkins | 229 | 100.00% | |
| Total votes | 229 | 100.00% | ||
| Republican Party Primary Results | ||||
| Republican | John E. Ducharme III (incumbent) | 529 | 100.00% | |
| Total votes | 529 | 100.00% | ||
| Party | Candidate | Votes | % | |
|---|---|---|---|---|
| Republican | John E. Ducharme III (incumbent) | 2,693 | 65.75% | |
| Democratic | Allison Mary Perkins | 1,403 | 34.25% | |
| Total votes | 4,096 | 100.00% | ||
| Republican hold | ||||
District 72[edit]
| Party | Candidate | Votes | % | |
|---|---|---|---|---|
| Republican Party Primary Results | ||||
| Republican | Larry C. Dunphy | 599 | 100.00% | |
| Total votes | 599 | 100.00% | ||
| Party | Candidate | Votes | % | |
|---|---|---|---|---|
| Republican | Larry C. Dunphy | 3,379 | 100.00% | |
| Total votes | 3,379 | 100.00% | ||
| Republican hold | ||||
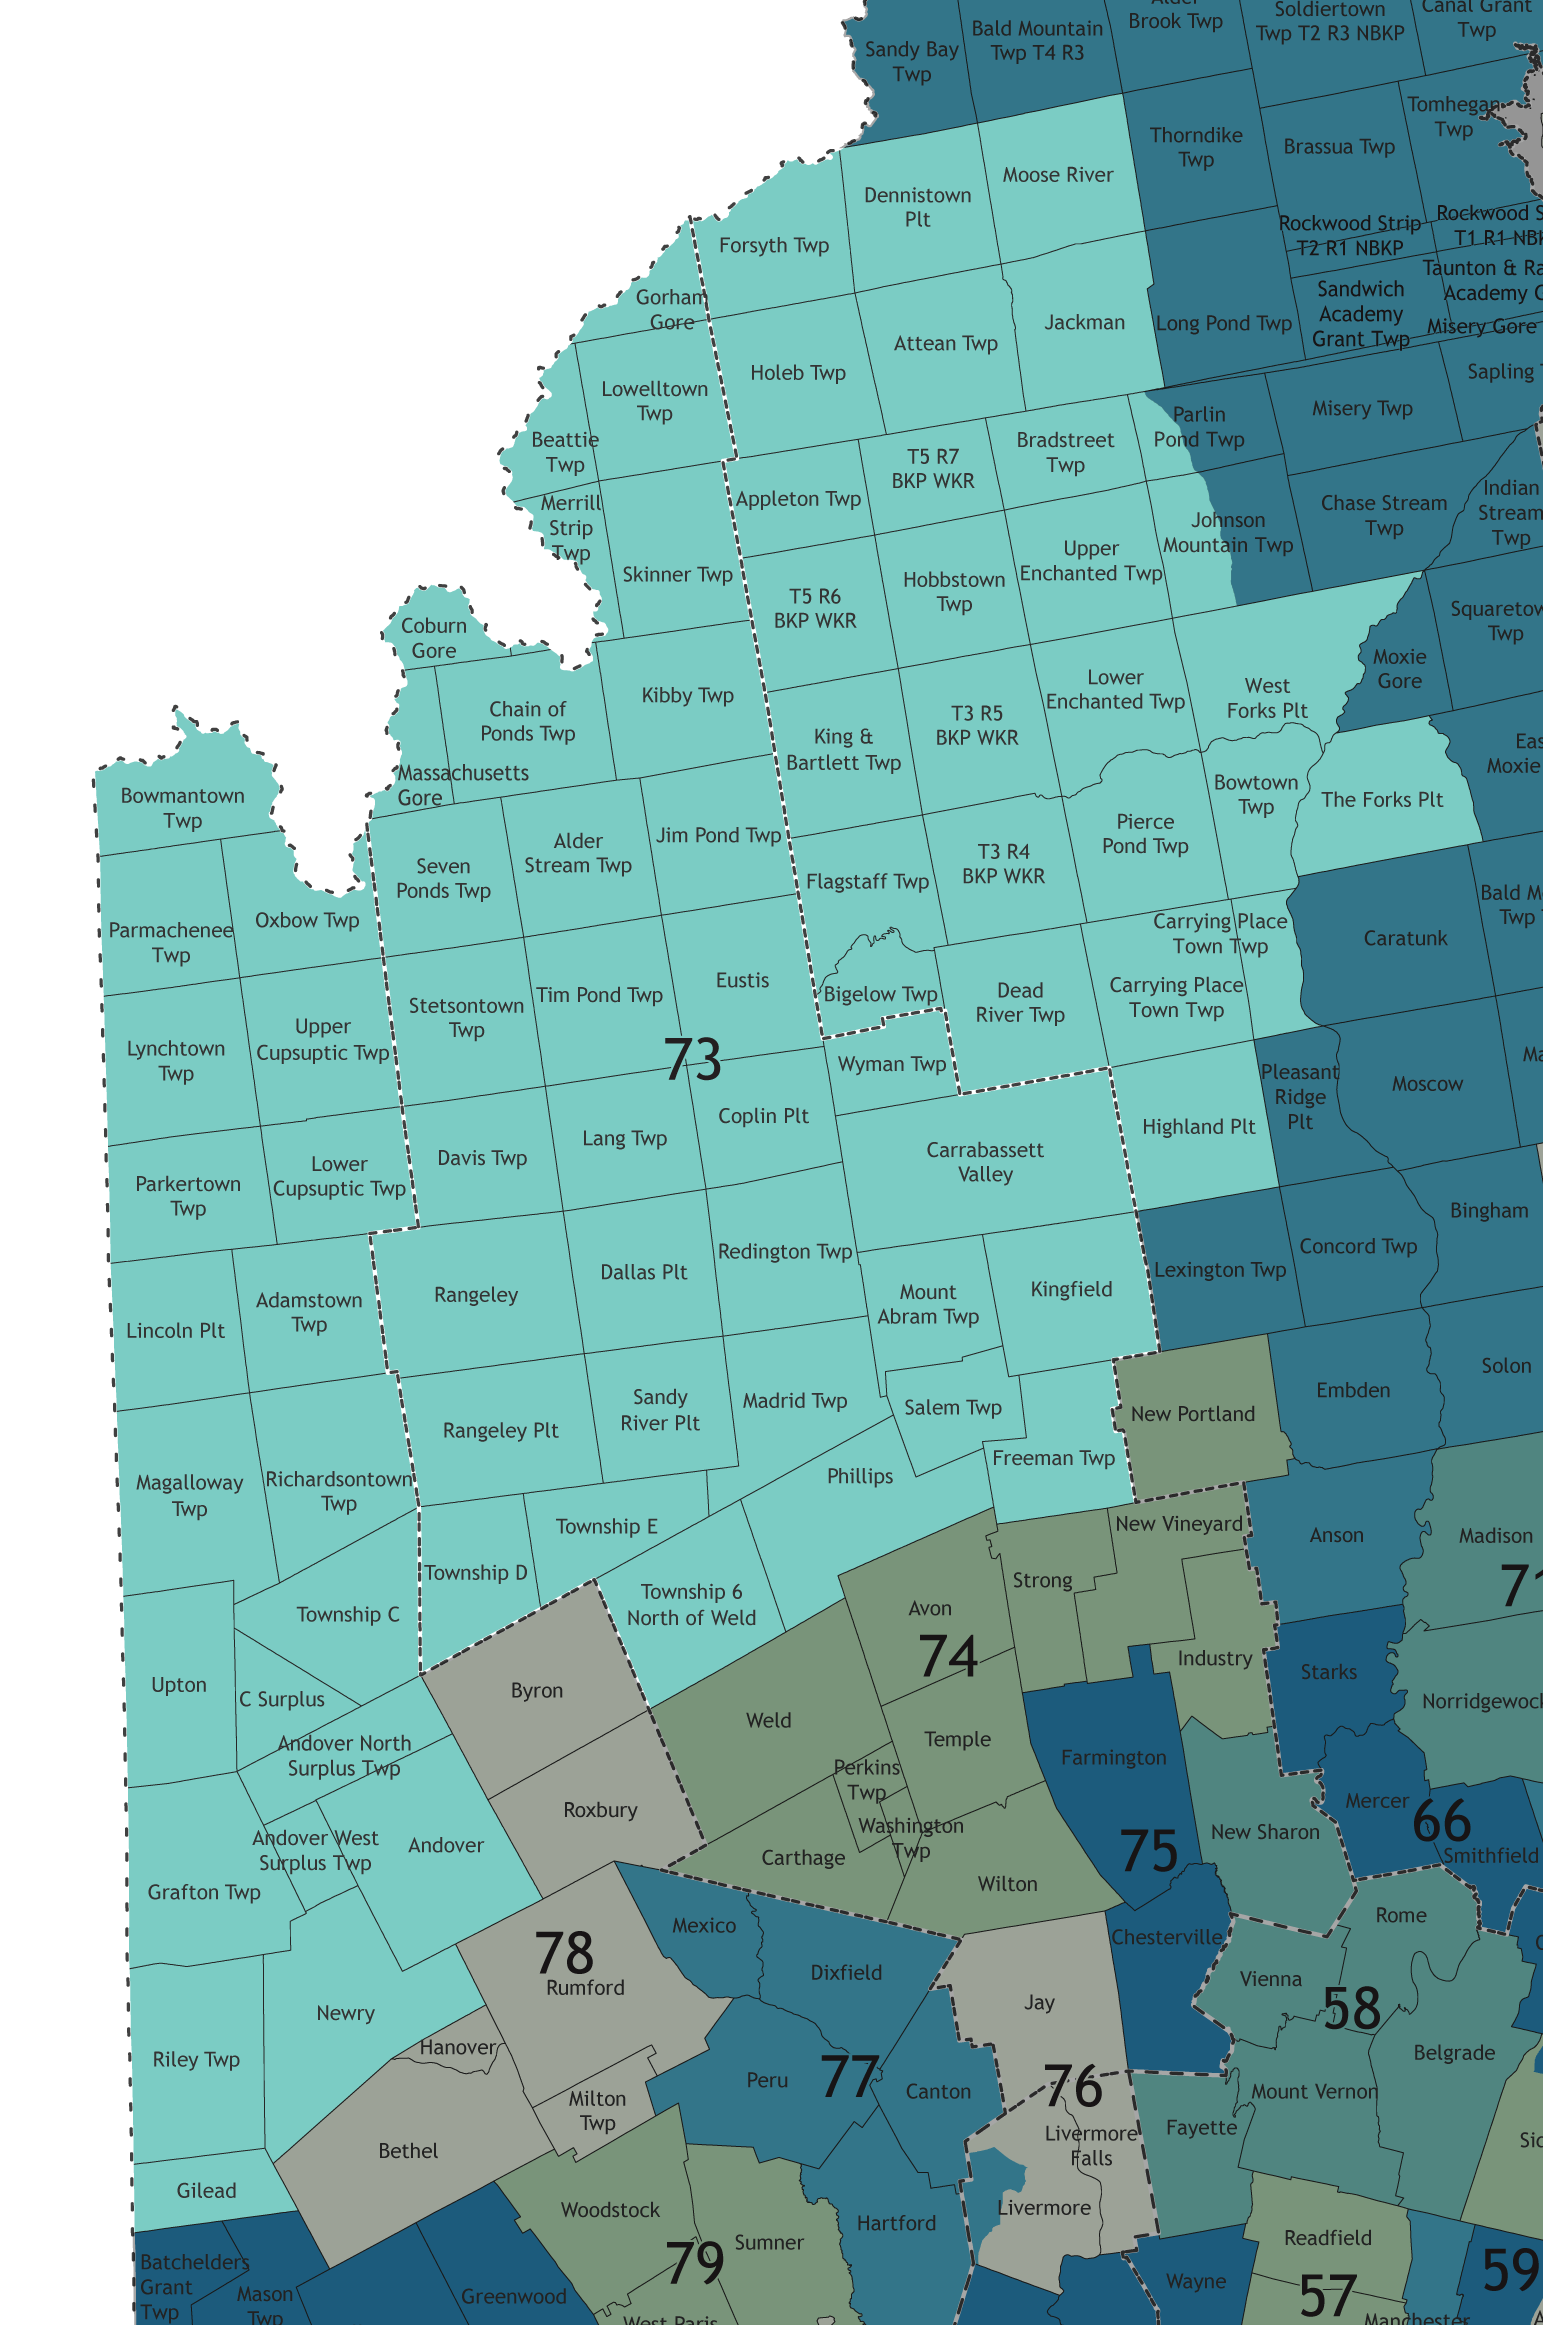
District 73[edit]
| Party | Candidate | Votes | % | |
|---|---|---|---|---|
| Democratic Party Primary Results | ||||
| Democratic | Vincent Michael House | 291 | 100.00% | |
| Total votes | 291 | 100.00% | ||
| Republican Party Primary Results | ||||
| Republican | Michael Soboleski | 418 | 50.30% | |
| Republican | Nancy J. Bessey | 413 | 49.70% | |
| Total votes | 831 | 100.00% | ||
| Party | Candidate | Votes | % | |
|---|---|---|---|---|
| Republican | Michael Soboleski | 2,824 | 57.26% | |
| Democratic | Vincent Michael House | 2,108 | 42.74% | |
| Total votes | 4,932 | 100.00% | ||
| Republican hold | ||||
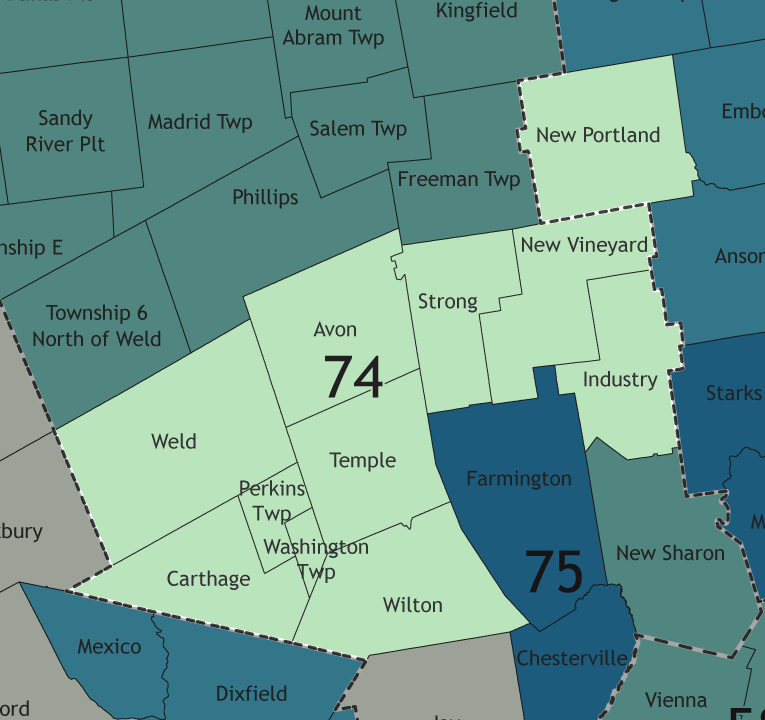
District 74[edit]
| Party | Candidate | Votes | % | |
|---|---|---|---|---|
| Democratic Party Primary Results | ||||
| Democratic | Gregory M. Kimber | 329 | 100.00% | |
| Total votes | 329 | 100.00% | ||
| Republican Party Primary Results | ||||
| Republican | Randall C. Hall (incumbent) | 538 | 100.00% | |
| Total votes | 538 | 100.00% | ||
| Party | Candidate | Votes | % | |
|---|---|---|---|---|
| Republican | Randall C. Hall (incumbent) | 2,945 | 62.95% | |
| Democratic | Gregory M. Kimber | 1,733 | 37.05% | |
| Total votes | 4,678 | 100.00% | ||
| Republican hold | ||||
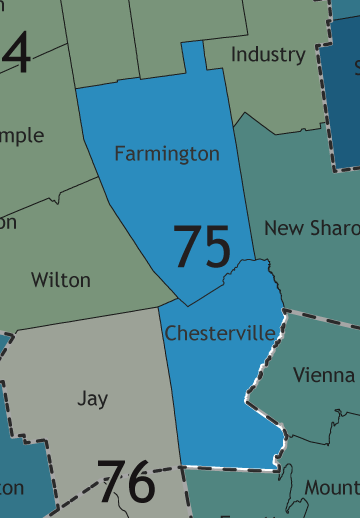
District 75[edit]
| Party | Candidate | Votes | % | |
|---|---|---|---|---|
| Democratic Party Primary Results | ||||
| Democratic | H. Scott Landry (incumbent) | 284 | 100.00% | |
| Total votes | 284 | 100.00% | ||
| Republican Party Primary Results | ||||
| Republican | Tiffany E. Estabrook | 300 | 100.00% | |
| Total votes | 300 | 100.00% | ||
| Party | Candidate | Votes | % | |
|---|---|---|---|---|
| Democratic | H. Scott Landry (incumbent) | 2,513 | 65.29% | |
| Republican | Tiffany E. Estabrook | 1,336 | 34.71% | |
| Total votes | 3,849 | 100.00% | ||
| Democratic hold | ||||
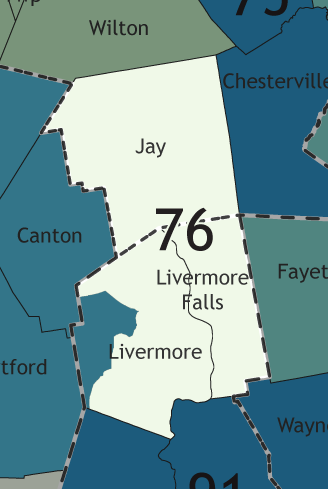
District 76[edit]
| Party | Candidate | Votes | % | |
|---|---|---|---|---|
| Democratic Party Primary Results | ||||
| Democratic | Tamara N. Hoke | 222 | 100.00% | |
| Total votes | 222 | 100.00% | ||
| Republican Party Primary Results | ||||
| Republican | Sheila A. Lyman (incumbent) | 358 | 100.00% | |
| Total votes | 358 | 100.00% | ||
| Party | Candidate | Votes | % | |
|---|---|---|---|---|
| Republican | Sheila A. Lyman (incumbent) | 2,530 | 59.63% | |
| Democratic | Tamara N. Hoke | 1,713 | 40.37% | |
| Total votes | 4,243 | 100.00% | ||
| Republican hold | ||||
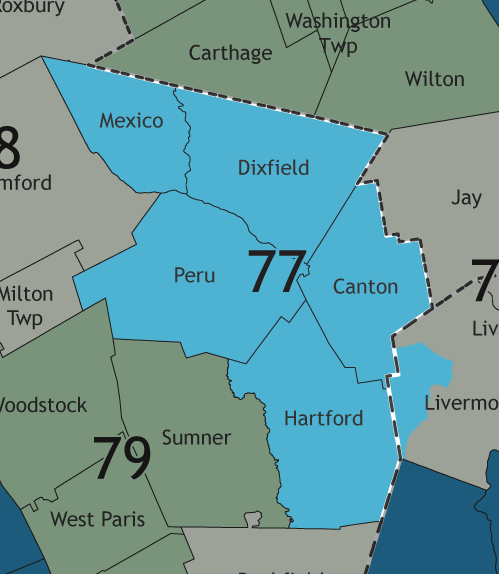
District 77[edit]
| Party | Candidate | Votes | % | |
|---|---|---|---|---|
| Democratic Party Primary Results | ||||
| Democratic | Bonita L. Bishop | 282 | 100.00% | |
| Total votes | 282 | 100.00% | ||
| Republican Party Primary Results | ||||
| Republican | Tammy L. Schmersal-Burgess | 384 | 60.57% | |
| Republican | Jody W. Brown | 250 | 39.43% | |
| Total votes | 634 | 100.00% | ||
| Party | Candidate | Votes | % | |
|---|---|---|---|---|
| Republican | Tammy L. Schmersal-Burgess | 2,694 | 66.55% | |
| Democratic | Bonita L. Bishop | 1,354 | 33.45% | |
| Total votes | 4,048 | 100.00% | ||
| Republican hold | ||||
District 78[edit]
| Party | Candidate | Votes | % | |
|---|---|---|---|---|
| Democratic Party Primary Results | ||||
| Democratic | David P. Thurston | 462 | 100.00% | |
| Total votes | 462 | 100.00% | ||
| Republican Party Primary Results | ||||
| Republican | Josanne C. Dolloff (incumbent)[s] | 427 | 100.00% | |
| Total votes | 427 | 100.00% | ||
| Party | Candidate | Votes | % | |
|---|---|---|---|---|
| Republican | Rachel Ann Henderson | 2,306 | 54.84% | |
| Democratic | David P. Thurston | 1,899 | 45.16% | |
| Total votes | 4,205 | 100.00% | ||
| Republican hold | ||||
District 79[edit]
| Party | Candidate | Votes | % | |
|---|---|---|---|---|
| Democratic Party Primary Results | ||||
| Democratic | Don R. Berry[t] | 238 | 100.00% | |
| Total votes | 238 | 100.00% | ||
| Republican Party Primary Results | ||||
| Republican | John E. Andrews (incumbent) | 318 | 50.16% | |
| Republican | Ryan G. Ricci | 181 | 28.55% | |
| Republican | Dannie D. Abbott | 135 | 21.29% | |
| Total votes | 634 | 100.00% | ||
| Party | Candidate | Votes | % | |
|---|---|---|---|---|
| Republican | John E. Andrews (incumbent) | 3,197 | 100.00% | |
| Total votes | 3,197 | 100.00% | ||
| Republican hold | ||||
District 80[edit]
| Party | Candidate | Votes | % | |
|---|---|---|---|---|
| Republican Party Primary Results | ||||
| Republican | Caldwell Jackson | 476 | 100.00% | |
| Total votes | 476 | 100.00% | ||
| Party | Candidate | Votes | % | |
|---|---|---|---|---|
| Republican | Caldwell Jackson | 3,722 | 100.00% | |
| Total votes | 3,722 | 100.00% | ||
| Republican hold | ||||
District 81[edit]
| Party | Candidate | Votes | % | |
|---|---|---|---|---|
| Democratic Party Primary Results | ||||
| Democratic | Daniel A. Sipe | 376 | 100.00% | |
| Total votes | 376 | 100.00% | ||
| Republican Party Primary Results | ||||
| Republican | H. Sawin Millett, Jr. (incumbent) | 488 | 100.00% | |
| Total votes | 488 | 100.00% | ||
| Party | Candidate | Votes | % | |
|---|---|---|---|---|
| Republican | H. Sawin Millett, Jr. (incumbent) | 2,517 | 54.30% | |
| Democratic | Daniel A. Sipe | 2,118 | 45.70% | |
| Total votes | 4,635 | 100.00% | ||
| Republican hold | ||||
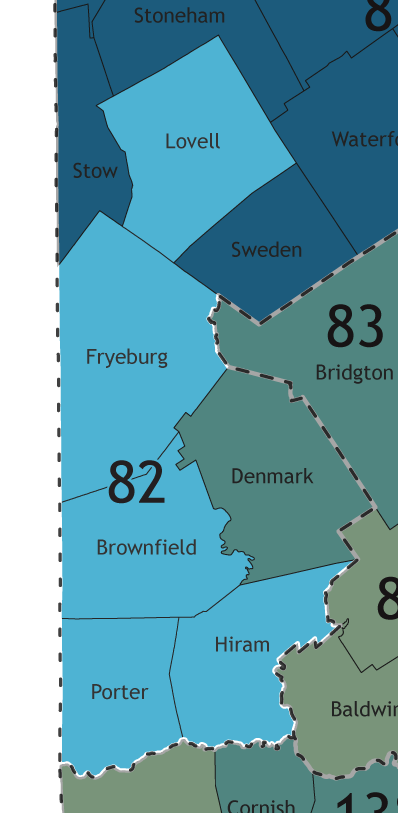
District 82[edit]
| Party | Candidate | Votes | % | |
|---|---|---|---|---|
| Democratic Party Primary Results | ||||
| Democratic | Nathan Robert Burnett | 288 | 100.00% | |
| Total votes | 288 | 100.00% | ||
| Republican Party Primary Results | ||||
| Republican | Caleb Joshua Ness | 371 | 100.00% | |
| Total votes | 371 | 100.00% | ||
| Party | Candidate | Votes | % | |
|---|---|---|---|---|
| Republican | Caleb Joshua Ness | 2,275 | 50.51% | |
| Democratic | Nathan Robert Burnett | 2,229 | 49.49% | |
| Total votes | 4,504 | 100.00% | ||
| Republican hold | ||||
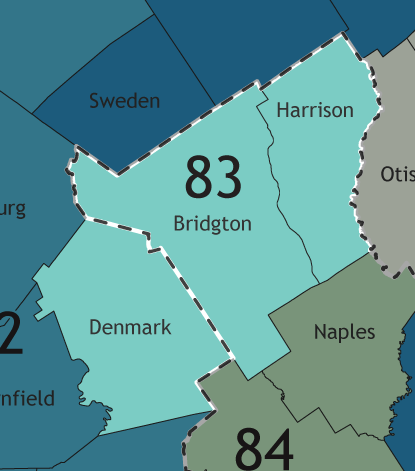
District 83[edit]
| Party | Candidate | Votes | % | |
|---|---|---|---|---|
| Republican Party Primary Results | ||||
| Republican | Donna Dodge | 463 | 68.80% | |
| Republican | Sierra Dyan Scribner | 210 | 31.20% | |
| Total votes | 673 | 100.00% | ||
| Party | Candidate | Votes | % | |
|---|---|---|---|---|
| Independent | Walter N. Riseman (incumbent)[u] | 2,491 | 52.00% | |
| Republican | Donna Dodge | 2,299 | 48.00% | |
| Total votes | 4,790 | 100.00% | ||
| Independent hold | ||||
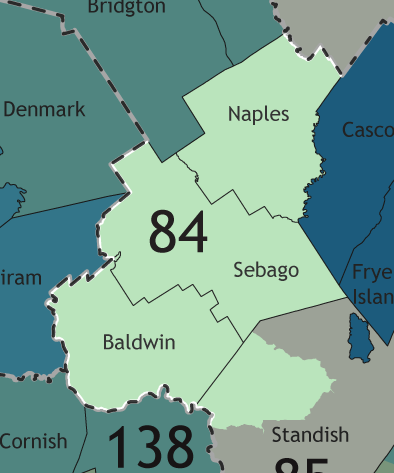
District 84[edit]
| Party | Candidate | Votes | % | |
|---|---|---|---|---|
| Democratic Party Primary Results | ||||
| Democratic | Barry F. Powers | 373 | 100.00% | |
| Total votes | 373 | 100.00% | ||
| Republican Party Primary Results | ||||
| Republican | Mark Walker | 655 | 100.00% | |
| Total votes | 655 | 100.00% | ||
| Party | Candidate | Votes | % | |
|---|---|---|---|---|
| Republican | Mark Walker | 2,720 | 58.63% | |
| Democratic | Barry F. Powers | 1,919 | 41.37% | |
| Total votes | 4,639 | 100.00% | ||
| Republican hold | ||||
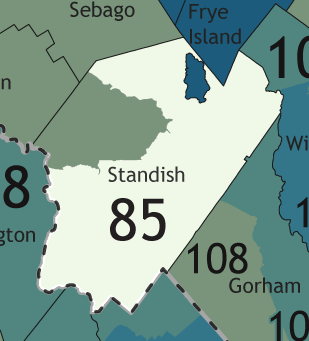
District 85[edit]
| Party | Candidate | Votes | % | |
|---|---|---|---|---|
| Democratic Party Primary Results | ||||
| Democratic | Christopher V. Struebing | 428 | 100.00% | |
| Total votes | 428 | 100.00% | ||
| Republican Party Primary Results | ||||
| Republican | Kimberly J. Pomerleau | 478 | 100.00% | |
| Total votes | 478 | 100.00% | ||
| Party | Candidate | Votes | % | |
|---|---|---|---|---|
| Republican | Kimberly J. Pomerleau | 2,337 | 54.90% | |
| Democratic | Christopher V. Struebing | 1,920 | 45.10% | |
| Total votes | 4,257 | 100.00% | ||
| Republican hold | ||||
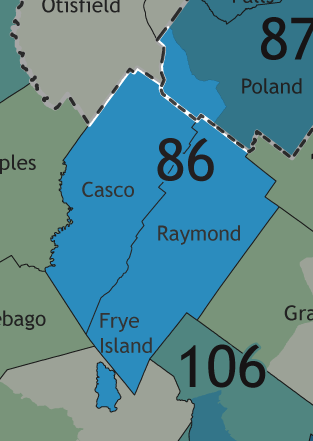
District 86[edit]
| Party | Candidate | Votes | % | |
|---|---|---|---|---|
| Democratic Party Primary Results | ||||
| Democratic | Jessica L. Fay (incumbent) | 355 | 100.00% | |
| Total votes | 355 | 100.00% | ||
| Republican Party Primary Results | ||||
| Republican | Gregory E. Foster | 340 | 71.88% | |
| Republican | Karen L. Lockwood | 133 | 28.12% | |
| Total votes | 473 | 100.00% | ||
| Party | Candidate | Votes | % | |
|---|---|---|---|---|
| Democratic | Jessica L. Fay (incumbent) | 2,421 | 51.59% | |
| Republican | Gregory E. Foster | 2,272 | 48.41% | |
| Total votes | 4,693 | 100.00% | ||
| Democratic hold | ||||
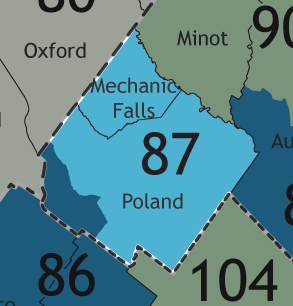
District 87[edit]
| Party | Candidate | Votes | % | |
|---|---|---|---|---|
| Republican Party Primary Results | ||||
| Republican | David W. Boyer | 342 | 100.00% | |
| Total votes | 342 | 100.00% | ||
| Party | Candidate | Votes | % | ||
|---|---|---|---|---|---|
| Republican | David W. Boyer | 2,434 | 61.13% | ||
| Independent | Mary-Beth H. Taylor[v] | 1,548 | 38.87% | ||
| Total votes | 3,982 | 100.00% | |||
| Republican win (new seat) | |||||
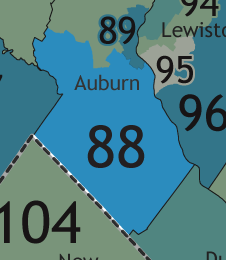
District 88[edit]
| Party | Candidate | Votes | % | |
|---|---|---|---|---|
| Democratic Party Primary Results | ||||
| Democratic | Kathleen A. Shaw | 225 | 100.00% | |
| Total votes | 225 | 100.00% | ||
| Republican Party Primary Results | ||||
| Republican | Patrick W. Munsell[w] | 272 | 100.00% | |
| Total votes | 272 | 100.00% | ||
| Party | Candidate | Votes | % | |
|---|---|---|---|---|
| Democratic | Kathleen A. Shaw | 2,074 | 50.87% | |
| Republican | James W. Sorcek | 2,003 | 49.13% | |
| Total votes | 4,077 | 100.00% | ||
| Democratic gain from Republican | ||||
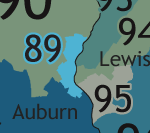
District 89[edit]
| Party | Candidate | Votes | % | |
|---|---|---|---|---|
| Democratic Party Primary Results | ||||
| Democratic | Adam R. Lee | 172 | 100.00% | |
| Total votes | 172 | 100.00% | ||
| Party | Candidate | Votes | % | |
|---|---|---|---|---|
| Democratic | Adam R. Lee | 1,342 | 56.77% | |
| Independent | Benjamin J. Weisner | 1,022 | 43.23% | |
| Total votes | 2,364 | 100.00% | ||
| Democratic hold | ||||
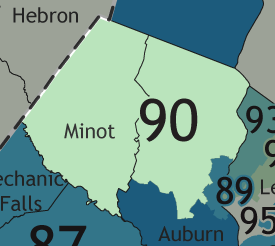
District 90[edit]
| Party | Candidate | Votes | % | |
|---|---|---|---|---|
| Democratic Party Primary Results | ||||
| Democratic | Amy Dieterich[x] | 367 | 100.00% | |
| Total votes | 367 | 100.00% | ||
| Republican Party Primary Results | ||||
| Republican | Laurel D. Libby (incumbent) | 345 | 100.00% | |
| Total votes | 345 | 100.00% | ||
| Party | Candidate | Votes | % | |
|---|---|---|---|---|
| Republican | Laurel D. Libby (incumbent) | 3,075 | 100.00% | |
| Total votes | 3,075 | 100.00% | ||
| Republican hold | ||||
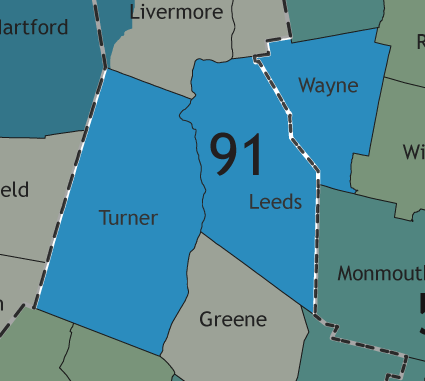
District 91[edit]
| Party | Candidate | Votes | % | |
|---|---|---|---|---|
| Democratic Party Primary Results | ||||
| Democratic | Hildie J. Lipson | 308 | 100.00% | |
| Total votes | 308 | 100.00% | ||
| Republican Party Primary Results | ||||
| Republican | Joshua K. Morris (incumbent) | 574 | 100.00% | |
| Total votes | 574 | 100.00% | ||
| Party | Candidate | Votes | % | |
|---|---|---|---|---|
| Republican | Joshua K. Morris (incumbent) | 3,014 | 62.70% | |
| Democratic | Hildie J. Lipson | 1,793 | 37.30% | |
| Total votes | 4,807 | 100.00% | ||
| Republican hold | ||||
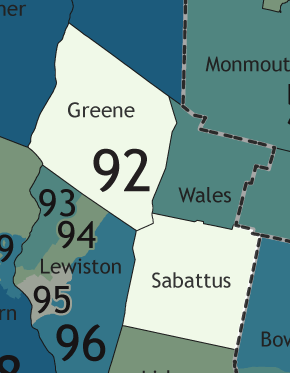
District 92[edit]
| Party | Candidate | Votes | % | |
|---|---|---|---|---|
| Republican Party Primary Results | ||||
| Republican | Stephen J. Wood | 358 | 55.85% | |
| Republican | Thomas Henry Martin, Jr. (incumbent) | 283 | 44.15% | |
| Total votes | 641 | 100.00% | ||
| Party | Candidate | Votes | % | |
|---|---|---|---|---|
| Republican | Stephen J. Wood | 3,728 | 100.00% | |
| Total votes | 3,728 | 100.00% | ||
| Republican hold | ||||
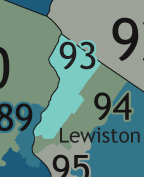
District 93[edit]
| Party | Candidate | Votes | % | |
|---|---|---|---|---|
| Democratic Party Primary Results | ||||
| Democratic | Margaret M. Craven (incumbent) | 183 | 100.00% | |
| Total votes | 183 | 100.00% | ||
| Republican Party Primary Results | ||||
| Republican | Robert Andrew McCarthy | 144 | 100.00% | |
| Total votes | 144 | 100.00% | ||
| Party | Candidate | Votes | % | |
|---|---|---|---|---|
| Democratic | Margaret M. Craven (incumbent) | 2,143 | 65.82% | |
| Republican | Robert Andrew McCarthy | 1,113 | 34.18% | |
| Total votes | 3,256 | 100.00% | ||
| Democratic hold | ||||
District 94[edit]
| Party | Candidate | Votes | % | |
|---|---|---|---|---|
| Democratic Party Primary Results | ||||
| Democratic | Kristen Sarah Cloutier (incumbent) | 172 | 100.00% | |
| Total votes | 172 | 100.00% | ||
| Republican Party Primary Results | ||||
|
| ||||