Plik:South Africa 2001 Afrikaans speakers proportion map.svg


Wielkość pliku podglądu PNG dla pliku SVG: 689 × 600 pikseli Inne rozdzielczości: 276 × 240 pikseli | 552 × 480 pikseli | 882 × 768 pikseli | 1177 × 1024 pikseli | 2353 × 2048 pikseli | 1072 × 933 pikseli.
Rozmiar pierwotny (Plik SVG, nominalnie 1072 × 933 pikseli, rozmiar pliku: 479 KB)
| Plik South Africa 2001 Afrikaans speakers proportion map.svg znajduje się w Wikimedia Commons – repozytorium wolnych zasobów. Dane z jego strony opisu znajdują się poniżej. |
Opis
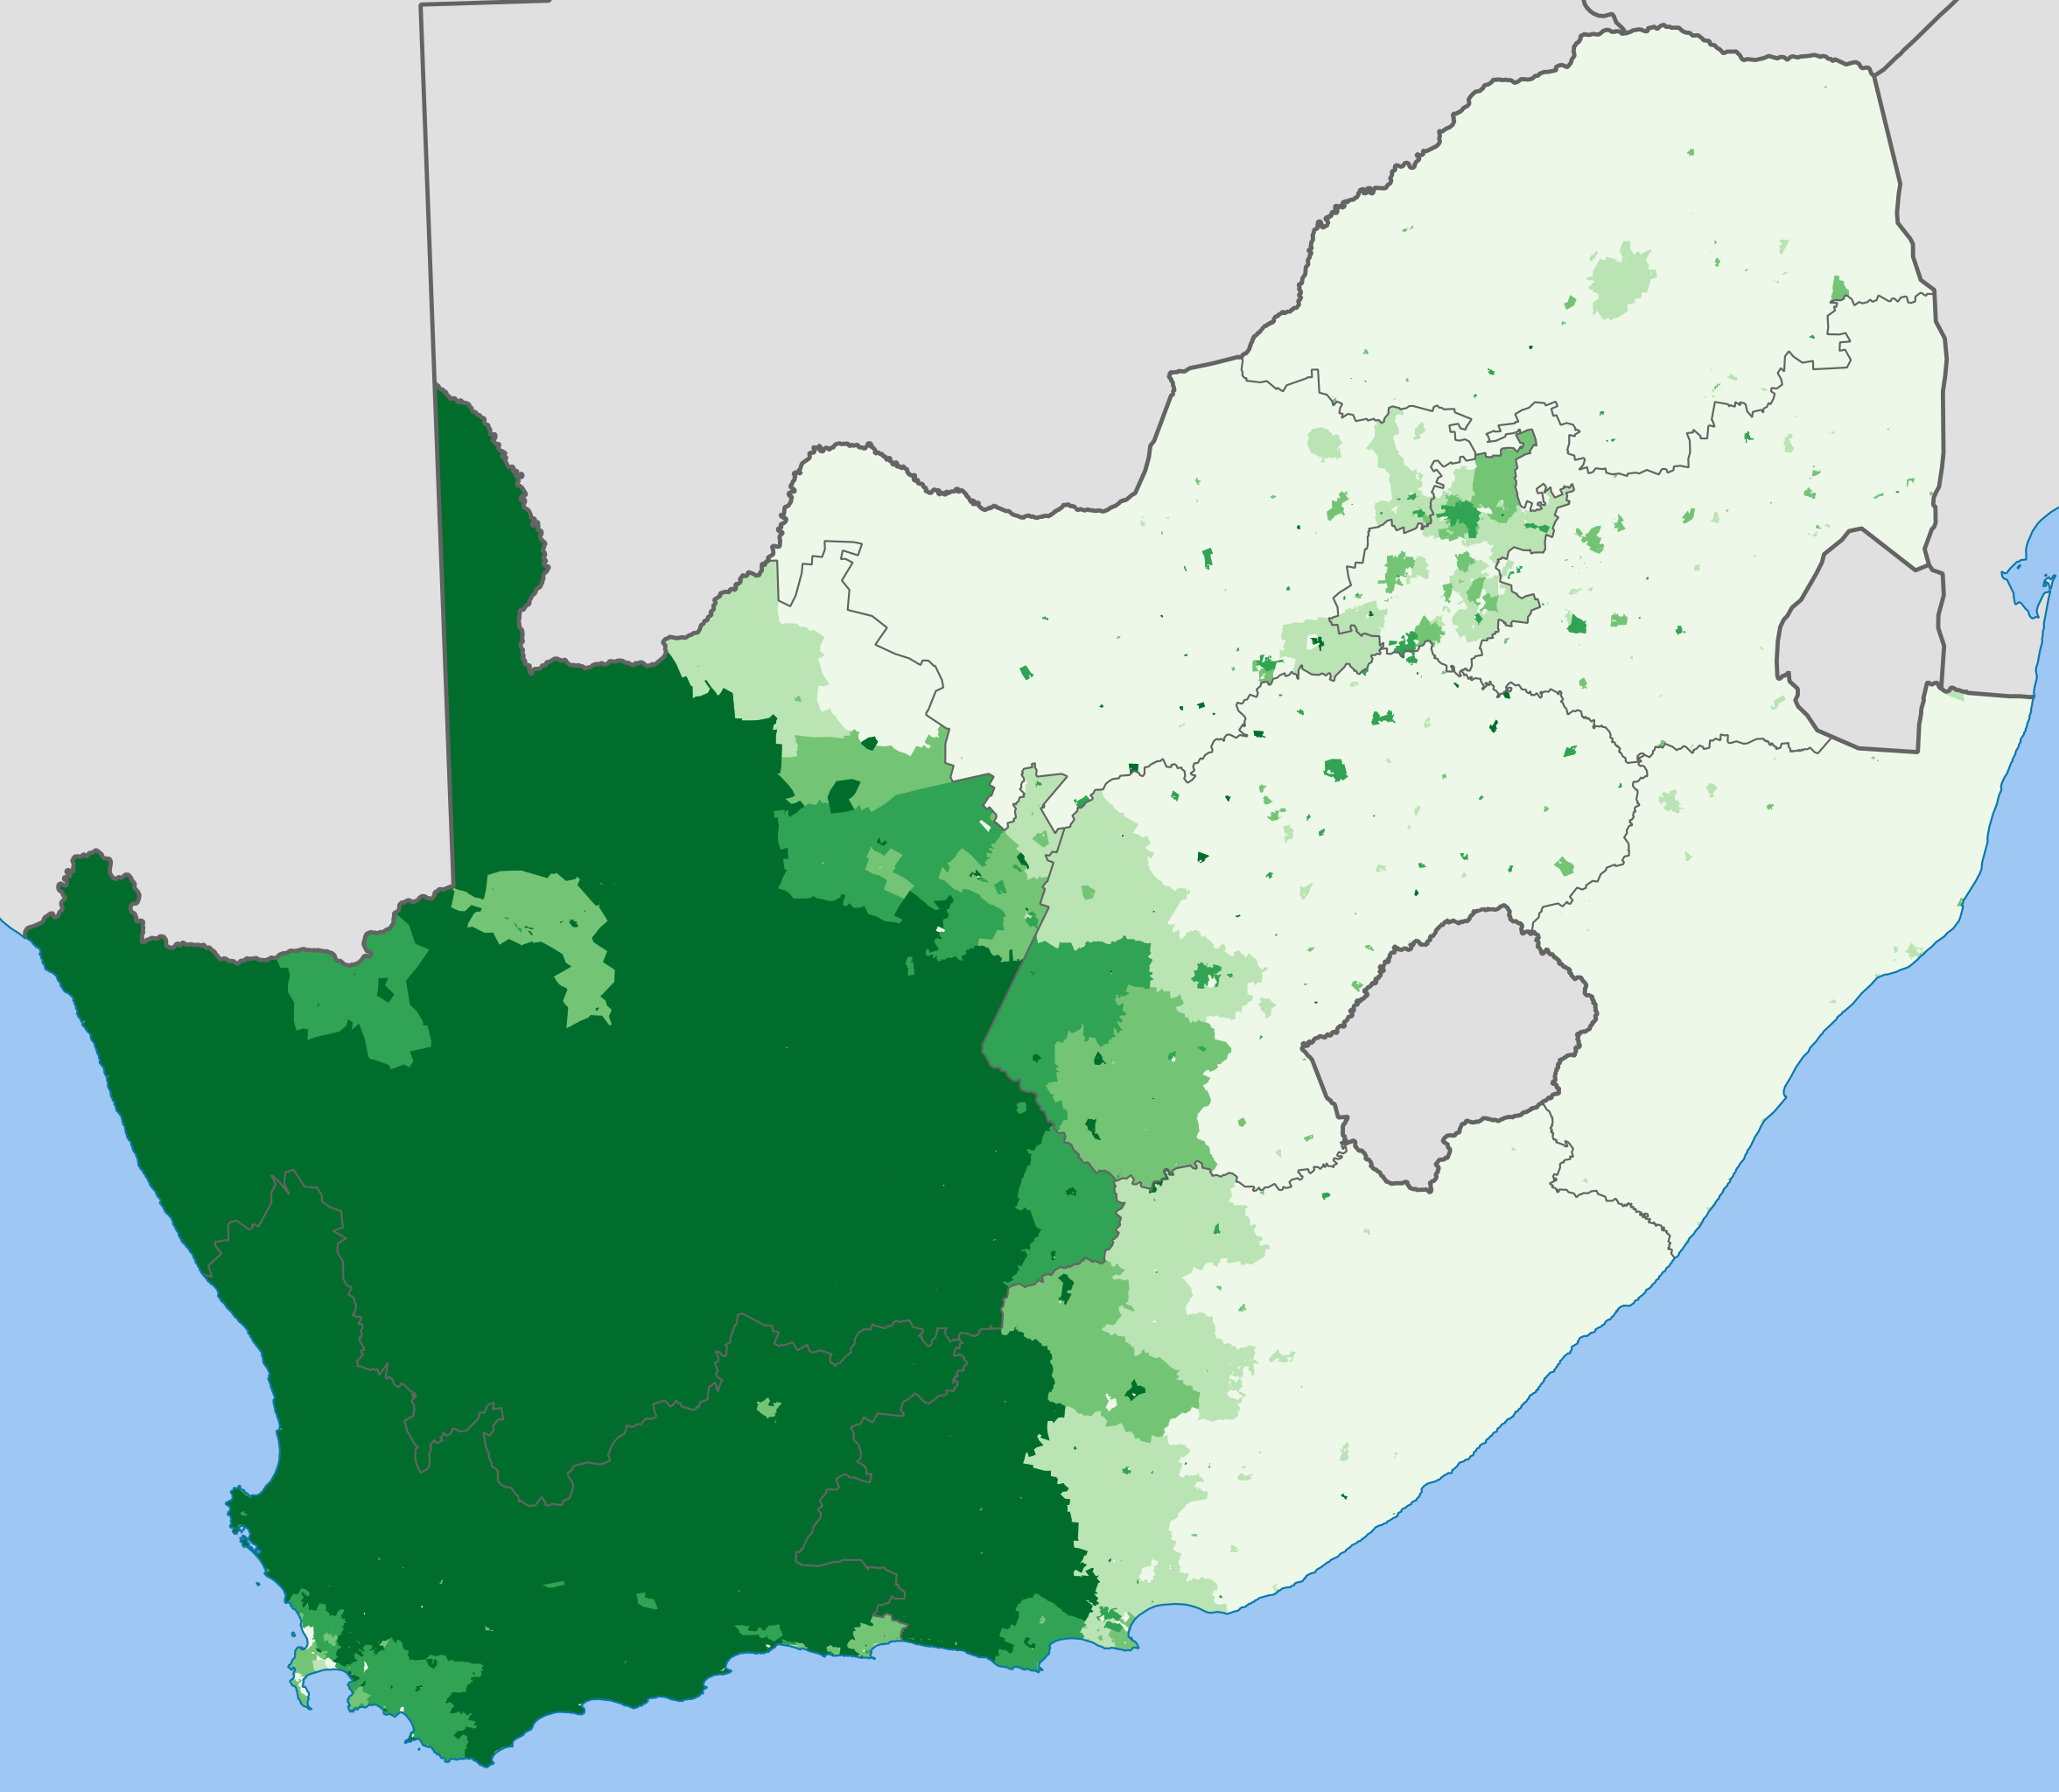
| Opis | English: Map showing the proportion of the South African population that speaks Afrikaans at home, from the 2001 census broken down to "Main Place" level. 0–20% 20–40% 40–60% 60–80% 80–100% Projection is Albers Equal-Area Conic, with standard parallels at 25.5° S and 31.5° S, and origin at 28.5° S 25.5° E. |
| Data | |
| Źródło | Statistics South Africa's Census 2001 is the source of the basic population data. The map results from my own processing of the data. |
| Autor | Htonl |
Licencja
The following license applies to the population data on which the map is based:
 | Właściciel autorskich praw majątkowych do tego pliku, Stats SA, zezwala każdemu wykorzystać go w dowolnym celu, pod warunkiem, że wykorzystujący wyraźnie wskaże autora. Redystrybucja, wykonywanie prac pochodnych, użycie komercyjne oraz każde inne są dozwolone. |
Uznanie autorstwa: "the user acknowledges Stats SA as the source of the basic data wherever they process, apply, utilise, publish or distribute the data, and also that they specify that the relevant application and analysis (where applicable) result from their own processing of the data" [1]
|
The following tag applies to the map itself:
| Ja, właściciel praw autorskich do tej pracy, udostępniam ją jako własność publiczną. Dotyczy to całego świata. W niektórych krajach może nie być to prawnie możliwe, jeśli tak, to: Zapewniam każdemu prawo do użycia tej pracy w dowolnym celu, bez żadnych ograniczeń, chyba że te ograniczenia są wymagane przez prawo. |
Historia pliku
Kliknij na datę/czas, aby zobaczyć, jak plik wyglądał w tym czasie.
| Data i czas | Miniatura | Wymiary | Użytkownik | Opis | |
|---|---|---|---|---|---|
| aktualny | 20:17, 3 kwi 2012 | | 1072 × 933 (479 KB) | Htonl | styles, color handling, color scheme |
| 12:46, 29 lis 2010 |  | 1072 × 933 (902 KB) | Htonl | remove grey "undefined" areas by drawing from municipal data | |
| 03:46, 2 paź 2010 |  | 1072 × 933 (925 KB) | Htonl | tweak | |
| 03:17, 2 paź 2010 |  | 1072 × 933 (838 KB) | Htonl | new approach, smaller filesize | |
| 22:17, 1 paź 2010 |  | 1072 × 933 (2,92 MB) | Htonl | use equal-area projection | |
| 21:15, 16 lut 2010 |  | 1000 × 786 (2,81 MB) | Htonl | tweak | |
| 22:56, 6 lut 2010 |  | 1000 × 786 (3,04 MB) | Htonl | == Summary == {{Information |Description={{en|1=Map showing the proportion of the South African population that speaks Afrikaans at home, from the 2001 census broken down to "Main Place" level. {{legend|#eff3ff|0–20%}} {{legend|#bdd7e7|20–40%}} {{lege |
Lokalne wykorzystanie pliku
Poniższa strona korzysta z tego pliku:
Globalne wykorzystanie pliku
Ten plik jest wykorzystywany także w innych projektach wiki:
- Wykorzystanie na eo.wiktionary.org
- Wykorzystanie na it.wikipedia.org
- Wykorzystanie na nl.wikipedia.org
- Wykorzystanie na nrm.wikipedia.org