Plik:COVID-19 Outbreak World Map per Capita.svg


Rozmiar pierwotny (Plik SVG, nominalnie 2921 × 1500 pikseli, rozmiar pliku: 2,78 MB)
| Plik COVID-19 Outbreak World Map per Capita.svg znajduje się w Wikimedia Commons – repozytorium wolnych zasobów. Dane z jego strony opisu znajdują się poniżej. |
 | This file may be updated to reflect new information. If you wish to use a specific version of the file without new updates being mirrored, please upload the required version as a separate file. |
Opis
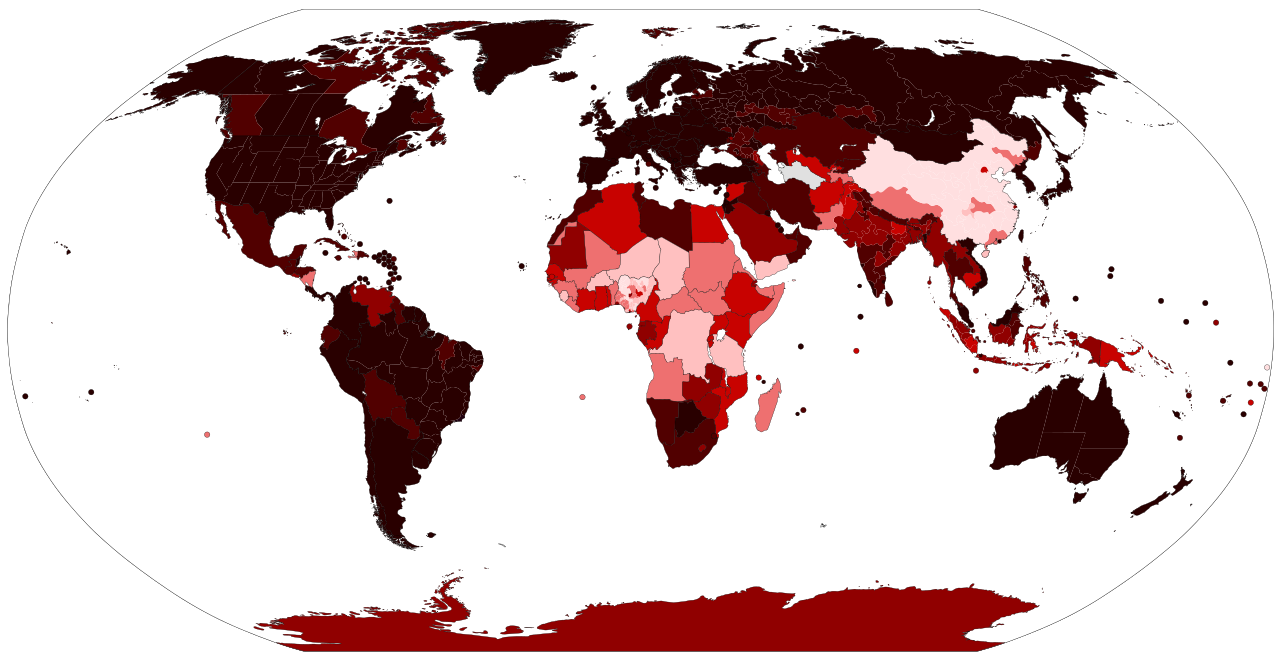
| Opis | Deutsch: Häufigkeit der gemeldeten Corona-Infektionen / pro 1000 Einwohner English: Map of the COVID-19 verified number of infected per capita as of . In the latest versions of the map there is a color bar legend. See the file history farther down for the latest upload date from the source. Español: Mapa del número verificado de infectados per cápita por la COVID-19 al . > 100 casos por 1.000 habitantes 30 – 100 casos por 1.000 habitantes 10 – 30 casos por 1.000 habitantes 3 – 10 casos por 1.000 habitantes 1 – 3 casos por 1.000 habitantes 0.3 – 1 casos por 1.000 habitantes > 0 – 0.3 casos por 1.000 habitantes No hay casos notificados, no hay población o no hay datos disponibles Français : Carte du nombre vérifié de cas d’infection à la covid-19 par habitant au . Português: Mapa do número de casos verificados de infectados pela COVID-19 per capita em . Русский: Карта количества подтверждённых случаев заражения COVID-19 на душу населения по состоянию на .y Українська: Карта підтвердженого числа інфікованих COVID-19 на душу населення станом на . 中文: 經驗證的各國感染人均COVID-19病例地圖,資料於更新。 Since this is a rapidly evolving situation, new cases may not be immediately represented visually. Refer to the primary article COVID-19 pandemic or the World Health Organization's situation reports for most recent reported case information. Legend information for older versions: Every country larger than 3 million km² or with a bigger population than 200 million people has been split up into its first level administrative division for better visualization of the spread of the epidemic. > 100 cases per 1,000 inhabitants 30 – 100 cases per 1,000 inhabitants 10 – 30 cases per 1,000 inhabitants 3 – 10 cases per 1,000 inhabitants 1 – 3 cases per 1,000 inhabitants 0.3 – 1 cases per 1,000 inhabitants > 0 – 0.3 cases per 1,000 inhabitants No reported cases, no population, or no data available |
| Data | 17 marca 2020 (First version). Date of first upload to the Wikimedia Commons. An upload link is at the end of the file history list. Please upload new versions at least once per week. Update the "point in time" date in the Wikidata entry linked below. {{wikidata|property|Q95963597|P585}} is used in map captions on Wikipedia. It provides the map date. To enable the date change click the purge link after updating the Wikidata entry. |
| Źródło | Latest versions: https://ourworldindata.org/explorers/coronavirus-data-explorer?tab=map&Metric=Confirmed+cases&Interval=Cumulative&Relative+to+Population=true&Align+outbreaks=false&country=~OWID_WRL - Our World in Data. Click on the download tab to download map. The table tab has a table of the exact data by country. Source tab says data is from the COVID-19 Data Repository by the Center for Systems Science and Engineering (CSSE) at Johns Hopkins University. The map at the source is interactive and provides more detail. For example, run your cursor over the color bar legend to see the countries that apply to that point in the legend. Older versions: Praca własna
|
| Autor | Raphaël Dunant, Gajmar (maintainer),幺于 (maintainer) |
| SVG rozwój |
Licencja
- Wolno:
- dzielić się – kopiować, rozpowszechniać, odtwarzać i wykonywać utwór
- modyfikować – tworzyć utwory zależne
- Na następujących warunkach:
- uznanie autorstwa – musisz określić autorstwo utworu, podać link do licencji, a także wskazać czy utwór został zmieniony. Możesz to zrobić w każdy rozsądny sposób, o ile nie będzie to sugerować, że licencjodawca popiera Ciebie lub Twoje użycie utworu.
Historia pliku
Kliknij na datę/czas, aby zobaczyć, jak plik wyglądał w tym czasie.
| Data i czas | Miniatura | Wymiary | Użytkownik | Opis | |
|---|---|---|---|---|---|
| aktualny | 07:54, 24 gru 2022 | | 2921 × 1500 (2,78 MB) | AKS471883 | update |
| 05:34, 7 gru 2022 |  | 2921 × 1500 (2,78 MB) | AKS471883 | update | |
| 09:58, 20 lis 2022 |  | 2921 × 1500 (2,78 MB) | AKS471883 | update | |
| 09:54, 31 sie 2022 |  | 2921 × 1500 (2,78 MB) | AKS471883 | update | |
| 09:40, 30 sie 2022 |  | 2921 × 1500 (2,78 MB) | 幺于 | update | |
| 09:42, 27 cze 2022 |  | 2921 × 1500 (2,78 MB) | 幺于 | update | |
| 05:36, 22 maj 2022 |  | 2921 × 1500 (2,78 MB) | 幺于 | update | |
| 04:52, 22 maj 2022 |  | 2921 × 1500 (2,78 MB) | AKS471883 | Update | |
| 14:38, 21 maj 2022 |  | 2921 × 1500 (2,78 MB) | AKS471883 | update | |
| 12:51, 19 maj 2022 |  | 2921 × 1500 (2,78 MB) | AKS471883 | Easter Island to Chile |
Lokalne wykorzystanie pliku
Następujące strony korzystają z tego pliku:
Globalne wykorzystanie pliku
Ten plik jest wykorzystywany także w innych projektach wiki:
- Wykorzystanie na af.wikipedia.org
- Wykorzystanie na ar.wikipedia.org
- Wykorzystanie na arz.wikipedia.org
- Wykorzystanie na ast.wikipedia.org
- Wykorzystanie na as.wikipedia.org
- Wykorzystanie na awa.wikipedia.org
- Wykorzystanie na azb.wikipedia.org
- Wykorzystanie na az.wikipedia.org
- Wykorzystanie na bg.wikipedia.org
- Wykorzystanie na bjn.wikipedia.org
- Wykorzystanie na bn.wikipedia.org
- Wykorzystanie na bo.wikipedia.org
- Wykorzystanie na br.wikipedia.org
- Wykorzystanie na ca.wikipedia.org
- Wykorzystanie na cs.wikipedia.org
- Wykorzystanie na dag.wikipedia.org
- Wykorzystanie na de.wikipedia.org
- Benutzer:Mapmaster
- COVID-19-Pandemie
- COVID-19-Pandemie in Italien
- COVID-19-Pandemie in Deutschland
- COVID-19-Pandemie in Südkorea
- COVID-19-Pandemie in der Schweiz
- COVID-19-Pandemie in Österreich
- Vorlage:Navigationsleiste COVID-19-Pandemie
- COVID-19-Pandemie in Frankreich
- COVID-19-Pandemie im Iran
- COVID-19-Pandemie in den Vereinigten Staaten
- COVID-19-Pandemie in der Volksrepublik China
- COVID-19-Pandemie in Spanien
- COVID-19-Pandemie in Osttimor
- COVID-19-Pandemie in Norwegen
- COVID-19-Pandemie in Afrika
- COVID-19-Pandemie in Dänemark
- COVID-19-Pandemie in Japan
- COVID-19-Pandemie in Finnland
- COVID-19-Pandemie in Polen
- COVID-19-Pandemie im Königreich der Niederlande
- COVID-19-Pandemie in Vietnam
- COVID-19-Pandemie in San Marino
- COVID-19-Pandemie im Vereinigten Königreich
- COVID-19-Pandemie in Belgien
- COVID-19-Pandemie in Israel
- COVID-19-Pandemie in Liechtenstein
- COVID-19-Pandemie in Indien
- COVID-19-Pandemie in Kanada
- COVID-19-Pandemie in Brasilien
- COVID-19-Pandemie in Portugal
- Benutzer:Triplec85/COVID-19-Pandemie in
Pokaż listę globalnego wykorzystania tego pliku.