파일:Normal distribution and scales.gif

원본 파일 (1,200 × 687 픽셀, 파일 크기: 39 KB, MIME 종류: image/gif)

이 그림은 벡터 그래픽 버전(SVG)이 있습니다. 래스터 그림 대신 벡터 그래픽 그림을 사용해야 합니다.

File:Normal distribution and scales.gif → File:The Normal Distribution.svg

벡터 그래픽에 대한 자세한 설명은 SVG 파일로 변환하기(영어) 문서를 참고해 주세요.
미디어위키의 SVG 그림 지원 정보(영어)도 같이 참고해주세요.

다른 언어로
Alemannisch  العربية  беларуская (тарашкевіца)  български  বাংলা  català  нохчийн  čeština  dansk  Deutsch  Ελληνικά  English  British English  Esperanto  español  eesti  euskara  فارسی  suomi  français  Frysk  galego  Alemannisch  עברית  हिन्दी  hrvatski  magyar  հայերեն  Bahasa Indonesia  Ido  italiano  日本語  ქართული  한국어  lietuvių  македонски  മലയാളം  Bahasa Melayu  မြန်မာဘာသာ  norsk bokmål  Plattdüütsch  Nederlands  norsk nynorsk  norsk  occitan  polski  prūsiskan  português  português do Brasil  română  русский  sicilianu  Scots  slovenčina  slovenščina  српски / srpski  svenska  தமிழ்  ไทย  Türkçe  татарча / tatarça  українська  vèneto  Tiếng Việt  中文  中文(中国大陆)  中文(简体)  中文(繁體)  中文(马来西亚)  中文(新加坡)  中文(臺灣)  +/−
새 SVG 이름

Maksim 사용자가 en.wikipedia에서 공용으로 옮겨왔습니다.

The original description page was here. All following user names refer to en.wikipedia.

파일 설명

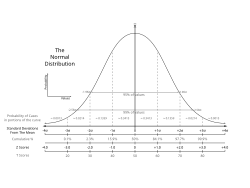
A chart comparing the various grading methods in a normal distribution. Includes: Standard deviations, cumulative percentages, percentile equivalents, Z-scores, T-scores, standard nine, percentage in stanine. Inspired by Figure 4.3 on Page 74 of Ward, A. W., Murray-Ward, M. (1999). Assessment in the Classroom. Belmont, CA: Wadsworth. ISBN 0534527043

라이선스

Public domain 나는 이 작품의 저작권자로서, 이 작품을 퍼블릭 도메인으로 모두에게 공개합니다. 이 공개 선언은 전 세계적으로 유효합니다.
만약 저작권의 포기가 법률적으로 가능하지 않은 경우,
나는 이 작품을 법적으로 허용되는 한도 내에서 누구나 자유롭게 어떤 목적으로도 제한없이 사용할 수 있도록 허용합니다.
date/time username edit summary
22:09, 19 December 2005 en:User:Jeremykemp (ISBN)
22:01, 19 December 2005 en:User:Jeremykemp (added reference)
21:53, 19 December 2005 en:User:Jeremykemp (A chart comparing the various grading methods in a normal distribution. Includes: Standard deviations, cummulative precentages, percentile equivalents, Z-scores, T-scores, standard nine, percent in stanine)

기존 올리기 기록

Legend: (cur) = this is the current file, (del) = delete this old version, (rev) = revert to this old version.

Click on date to download the file or see the image uploaded on that date.

  • (del) (cur) 21:53, 19 December 2005 . . en:User:Jeremykemp Jeremykemp ( en:User_talk:Jeremykemp Talk) . . 1200x687 (39575 bytes) (A chart comparing the various grading methods in a normal distribution. Includes: Standard deviations, cummulative precentages, percentile equivalents, Z-scores, T-scores, standard nine, percent in stanine)

설명

이 파일이 나타내는 바에 대한 한 줄 설명을 추가합니다

이 파일에 묘사된 항목

다음을 묘사함

파일 역사

날짜/시간 링크를 클릭하면 해당 시간의 파일을 볼 수 있습니다.

날짜/시간섬네일크기사용자설명
현재2006년 3월 21일 (화) 03:122006년 3월 21일 (화) 03:12 판의 섬네일1,200 × 687 (39 KB)MaksimLa bildo estas kopiita de wikipedia:en. La originala priskribo estas: == Summary == A chart comparing the various grading methods in a normal distribution. Includes: Standard deviations, cummulative precentages, percentile equivalents, Z-scores, T-scores

다음 문서 1개가 이 파일을 사용하고 있습니다:

이 파일을 사용하고 있는 모든 위키의 문서 목록

다음 위키에서 이 파일을 사용하고 있습니다: