ファイル:Oregon Population Growth by County.png

このプレビューのサイズ: 685 × 599 ピクセル。 その他の解像度: 274 × 240 ピクセル | 549 × 480 ピクセル。
元のファイル (800 × 700 ピクセル、ファイルサイズ: 24キロバイト、MIME タイプ: image/png)
ウィキメディア・コモンズのファイルページにある説明を、以下に表示します。 |
概要
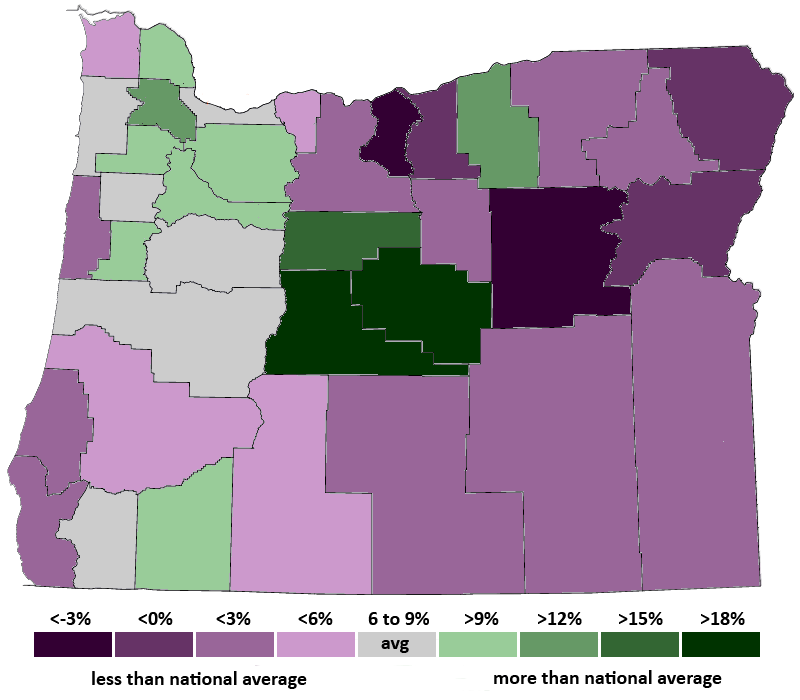
| 解説 | Oregon Population Growth by County, 2000-2007. Population growth in the green counties was higher than the national average, while growth in the purple counties was lower than the national average. Oregon's total population growth was 9.5%, compared with the national average of 7.7%. The fastest growing county was Deschutes at 39.4%. Leading the way in the Portland metro area was Washington County at 14.8%, followed by Clackamas at 10.0%, Yamhill at 9.5%, and Multnomah at 7.5%. | ||
| 日付 | |||
| 原典 | self-made using the state map at Image:Oregon counties.PNG and the 2007 Annual Population Report from the Portland State Population Research Center. | ||
| 作者 | Northwest-historian | ||
| 許可 (ファイルの再利用) | public domain | ||
| その他のバージョン |
|

ライセンス
| この著作物の著作権者である私は、この著作物における権利を放棄しパブリックドメインとします。これは全世界で適用されます。 一部の国では、これが法的に可能ではない場合があります。その場合は、次のように宣言します。 私は、あらゆる人に対して、法により必要とされている条件を除き、如何なる条件も課すことなく、あらゆる目的のためにこの著作物を使用する権利を与えます。 |
ファイルの履歴
過去の版のファイルを表示するには、その版の日時をクリックしてください。
| 日付と時刻 | サムネイル | 寸法 | 利用者 | コメント | |
|---|---|---|---|---|---|
| 現在の版 | 2008年4月3日 (木) 10:43 | | 800 × 700 (24キロバイト) | Northwest-historian | {{Information |Description=Oregon Population Growth by County, 2000-2007. Population growth in the green counties was higher than the national average, while growth in the purple counties was lower than the national average. Oregon's total population grow |
ファイルの使用状況
以下の 4 ページがこのファイルを使用しています:
グローバルなファイル使用状況
以下に挙げる他のウィキがこの画像を使っています: