ファイル:Economics Gini coefficient2.svg


この SVG ファイルのこの PNG プレビューのサイズ: 500 × 500 ピクセル. その他の解像度: 240 × 240 ピクセル | 480 × 480 ピクセル | 768 × 768 ピクセル | 1,024 × 1,024 ピクセル | 2,048 × 2,048 ピクセル。
元のファイル (SVG ファイル、500 × 500 ピクセル、ファイルサイズ: 2キロバイト)
ウィキメディア・コモンズのファイルページにある説明を、以下に表示します。 |
概要
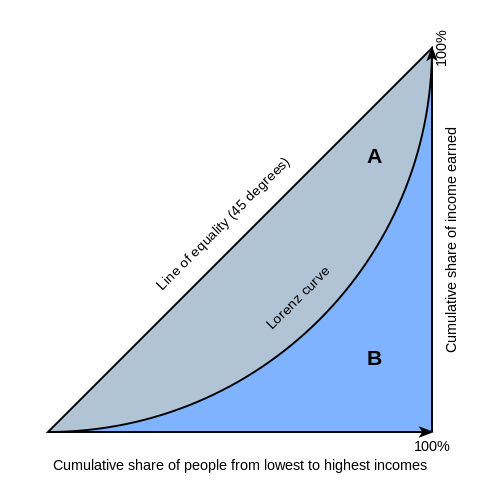
| 解説 | English: Gini coefficient diagram, based on the version by Bluemoose/BenFrantzDale. You can think of the horizontal axis as percent of people and the vertical axis as the percent of income those people receive. Therefore the Lorenz curves always start and end at the same places, where 0% of people make 0% of the country's income and 100% of people make 100% of the total income. Inequality is implied when the curve is below the 45-degree line: At the left, the percentage of people is higher than the percent of income they receive (i.e. 10% of the people getting 5% of the total income); at the right, the percent of income received rises more than the percent of people receiving it. The area above the Lorenz curve -- marked "A" -- is shaded differently from the area below the curve -- marked "B". This simplifies the mathematical explanation of the gini coefficient, which is A/(A+B) |
| 日付 | |
| 原典 | The original file was on WikiMedia Commons (http://en.wikipedia.org/wiki/File:Economics_Gini_coefficient.svg). I have edited the file. |
| 作者 | Reidpath |
| その他のバージョン | このファイルの派生的著作物: Economics Gini coefficient2-ar.svg |
ライセンス
この画像に書かれているテキストは、「文学の著作物」や現地の著作権法でのその他の保護対象ではないため、著作権の対象とはならないことから、パブリックドメインの状態にあります。一般的な書体や基本的な手書き文字、単純な幾何学的形状等、十分な創作性が無くとも一般的な財産である事実やデータ、独創性の無い情報は、著作権によって保護されません。 このタグは、一般的に全てのテキストの画像に適用される訳ではありません。特定の国では、著作権の対象となる「文学の著作物」の法的定義が異なり、裁判所の解釈の仕方も異なる場合があります。ほぼ全ての書面の著作物を保護する国がある一方、芸術性や科学性に特出した文章やデータベースのみを保護する国もあります。「文学の著作物」の定義は、創作の程度、機能、文章の長さに左右される場合があります。著作権の保護は、文学形式に限定することができ、含まれる情報自体を保護の対象外とすることができます。 |
ファイルの履歴
過去の版のファイルを表示するには、その版の日時をクリックしてください。
| 日付と時刻 | サムネイル | 寸法 | 利用者 | コメント | |
|---|---|---|---|---|---|
| 現在の版 | 2021年3月6日 (土) 18:00 | | 500 × 500 (2キロバイト) | Nyq | decapitalized common nouns |
| 2016年3月20日 (日) 16:52 |  | 500 × 500 (2キロバイト) | Wylve | Fixed CSS | |
| 2016年3月20日 (日) 16:51 |  | 500 × 500 (2キロバイト) | Wylve | Reduce tracing artifacts | |
| 2009年6月24日 (水) 15:18 |  | 500 × 500 (7キロバイト) | Reidpath | {{Information |Description={{en|1=Gini coefficient diagram, based on the version by Bluemoose/BenFrantzDale. You can think of the horizontal axis as percent of people and the vertical axis as the percent of income those people receive. Therefore the Loren |
ファイルの使用状況
以下のページがこのファイルを使用しています:
グローバルなファイル使用状況
以下に挙げる他のウィキがこの画像を使っています:
- af.wikipedia.org での使用状況
- ar.wikipedia.org での使用状況
- bh.wikipedia.org での使用状況
- bn.wikipedia.org での使用状況
- en.wikipedia.org での使用状況
- Gini coefficient
- Lorenz curve
- Poverty
- Portal:Mathematics/Featured picture archive
- Wikipedia:Reference desk/Archives/Humanities/2010 December 18
- Portal:Mathematics/Featured picture/2012 08
- Wikipedia:Village pump (technical)/Archive 106
- Portal:Mathematics/Selected picture
- Portal:Mathematics/Selected picture/11
- User:Lexsta/sandbox
- et.wikipedia.org での使用状況
- fa.wikipedia.org での使用状況
- he.wikipedia.org での使用状況
- it.wikipedia.org での使用状況
- km.wikipedia.org での使用状況
- la.wikipedia.org での使用状況
- ms.wikipedia.org での使用状況
- nl.wikipedia.org での使用状況
- ro.wikipedia.org での使用状況
- si.wikipedia.org での使用状況
- sq.wikipedia.org での使用状況
- sr.wikipedia.org での使用状況
- te.wikipedia.org での使用状況
- ur.wikipedia.org での使用状況