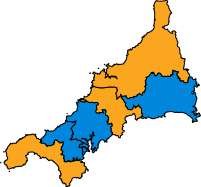
Liste des circonscriptions électorales de Cornouailles

Le comté cérémoniel des Cornouailles, qui comprend les îles Scilly, est divisé en six circonscriptions électorales. Ils sont tous County constituencies.
Histoire parlementaire des Cornouailles[modifier | modifier le code]
Circonscriptions[modifier | modifier le code]
| Circonscription | Électeur[1] | Majorité[nb 1] | député | 2nd-placed candidate | Circonscriptions électorales[2],[3] | Carte | ||
|---|---|---|---|---|---|---|---|---|
| Camborne and Redruth | 66,944 | 7,004 | George Eustice† | Michael Foster‡ | Carrick District Council: Mount Hawke. Kerrier District Council: Camborne North, Camborne South, Camborne West, Constantine, Gweek and Mawnan, Illogan North, Illogan South, Mabe and Budock, Redruth North, Redruth South, St Day, Lanner and Carharrack, Stithians, Wendron. Penwith District Council: Gwinear, Gwithian and Hayle East, Hayle North, Hayle South. |  | ||
| North Cornwall | 67,192 | 6,621 | Scott Mann† | Dan Rogerson¤ | North Cornwall District Council: Allan, Altarnun, Blisland and St Breward, Bodmin St Mary’s, Bodmin St Petroc, Bude, Camelford, Camelot, Grenville, Lanivet, Launceston, Marhamchurch, North Petherwin, Padstow and District, Poughill and Stratton, St Endellion and St Kew, St Minver, South Petherwin, Stokeclimsland, Tremaine, Valency, Wadebridge, Week St Mary and Whitstone. |  | ||
| St Austell and Newquay | 76,607 | 8,173 | Steve Double† | Steve Gilbert¤ | Restormel Borough Council: Bethel, Crinnis, Edgcumbe North, Edgcumbe South, Fowey and Tywardreath, Gannel, Gover, Mevagissey, Mount Charles, Poltair, Rialton, Rock, St Blaise, St Columb, St Enoder, St Ewe, St Stephen, Treverbyn. |  | ||
| St Ives | 67,282 | 2,469 | Derek Thomas† | Andrew George¤ | Kerrier District Council : Breage and Crowan, Grade-Ruan and Landewednack, Helston North, Helston South, Meneage, Mullion, Porthleven and Sithney, St Keverne. Penwith District Council: Goldsithney, Gulval and Heamoor, Lelant and Carbis Bay, Ludgvan and Towednack, Madron and Zennor, Marazion and Perranuthnoe, Morvah, Pendeen and St Just, Penzance Central, Penzance East, Penzance Promenade, Penzance South, St Buryan, St Erth and St Hilary, St Ives North, St Ives South. Isles of Scilly. |  | ||
| South East Cornwall | 71,071 | 16,995 | Sheryll Murray† | Phil Hutty¤ | Caradon District Council: Callington, Calstock, Deviock and Sheviock, Dobwalls and District, Duloe, Lansallos and Pelynt, Landrake and St Dominick, Lanteglos and St Veep, Liskeard North, Liskeard South, Looe and St Martin, Lynher, Menheniot and St Ive, Millbrook, Rame Peninsula, St Cleer and St Neot, St Germans, Saltash Burraton, Saltash Essa, Saltash Pill, Saltash St Stephens, Torpoint East, Torpoint West. Restormel Borough Council: Lostwithiel. |  | ||
| Truro and Falmouth | 73,601 | 14,000 | Sarah Newton† | Simon Rix¤ | Carrick District Council: Arwenack, Boscawen, Boslowick, Carland, Feock and Kea, Kenwyn and Chacewater, Moresk, Mylor, Newlyn and Goonhavern, Penryn, Penwerris, Perranporth, Probus, Roseland, St Agnes, Tregolls, Trehaverne and Gloweth, Trescobeas. |  | ||
Résultats[modifier | modifier le code]
| 1983 | 1987 | 1992 | 1997 |
|---|---|---|---|
 |  |  |  |
| 2001 | 2005 | 2010 | 2015 |
 |  |  |  |
Party breakdown[modifier | modifier le code]
| Année | Conservateur Party[4] | Labour Party | Liberal Democrats[5] | Total |
|---|---|---|---|---|
| 2015 | 6 (100%) | 0 (0%) | 0 (0%) | 6 |
| 2010 | 3 (50%) | 0 (0%) | 3 (50%) | 6 |
| 2005 | 0 (0%) | 0 (0%) | 5 (100%) | 5 |
| 2001 | 0 (0%) | 1 (20%) | 4 (80%) | 5 |
| 1997 | 0 (0%) | 1 (20%) | 4 (80%) | 5 |
| 1992 | 3 (60%) | 0 (0%) | 2 (40%) | 5 |
| 1987 | 4 (80%) | 0 (0%) | 1 (20%) | 5 |
| 1983 | 4 (80%) | 0 (0%) | 1 (20%) | 5 |
| 1979 | 4 (80%) | 0 (0%) | 1 (20%) | 5 |
| 1974 (Oct) | 3 (60%) | 0 (20%) | 2 (40%) | 5 |
| 1974 (Feb) | 3 (60%) | 0 (20%) | 2 (40%) | 5 |
| 1970 | 4 (80%) | 0 (0%) | 1 (20%) | 5 |
| 1966 | 2 (40%) | 1 (20%) | 2 (40%) | 5 |
| 1964 | 3 (60%) | 1 (20%) | 1 (20%) | 5 |
| 1959 | 4 (80%) | 1 (20%) | 0 (0%) | 5 |
| 1955 | 4 (80%) | 1 (20%) | 0 (0%) | 5 |
| 1951 | 4 (80%) | 1 (20%) | 0 (0%) | 5 |
| 1950 | 4 (80%) | 1 (20%) | 0 (0%) | 5 |
| 1945 | 3 | 1 | 1 | 5 |
| 1935 | 4 | 0 | 1 | 5 |
| 1931 | 3 | 0 | 2 | 5 |
| 1929 | 5 | |||
| 1924 | 5 | |||
| 1923 | 5 | |||
| 1922 | 5 | |||
| 1918 | 5 |
Notes[modifier | modifier le code]
- The majority is the number of votes the winning candidate receives more than their nearest rival.
Références[modifier | modifier le code]
- (en) « 2015 Electorates »
- (en) « The Parliamentary Constituencies (England) Order 2007 », Office of Public Sector Information, Crown copyright, (consulté le )
- Boundary Commission for England pp. 1004–1007
- National Liberal Party took the Party whip
- Formerly the Liberal Party
- (en) Cet article est partiellement ou en totalité issu de l’article de Wikipédia en anglais intitulé « List of Parliamentary constituencies in Cornwall » (voir la liste des auteurs).

