Fichier:South Africa 2011 dominant language map.svg


Taille de cet aperçu PNG pour ce fichier SVG : 684 × 599 pixels. Autres résolutions : 274 × 240 pixels | 548 × 480 pixels | 876 × 768 pixels | 1 168 × 1 024 pixels | 2 337 × 2 048 pixels | 809 × 709 pixels.
Fichier d’origine (Fichier SVG, nominalement de 809 × 709 pixels, taille : 798 kio)
Ce fichier et sa description proviennent de Wikimedia Commons.
Description
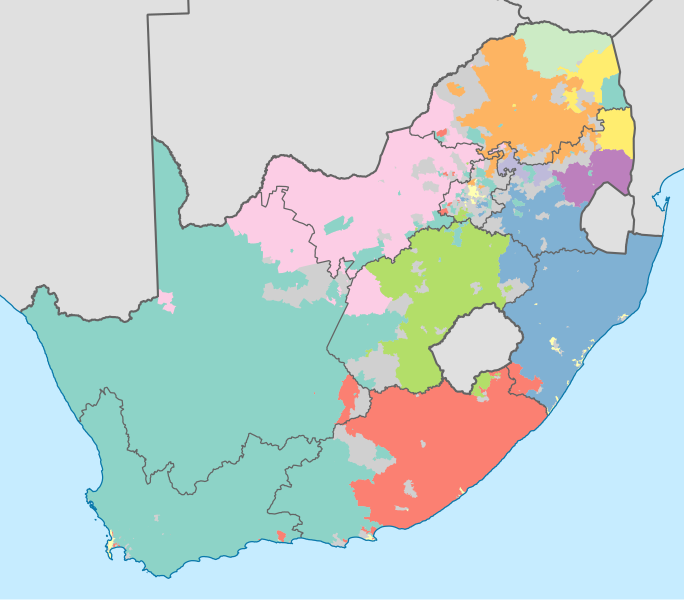
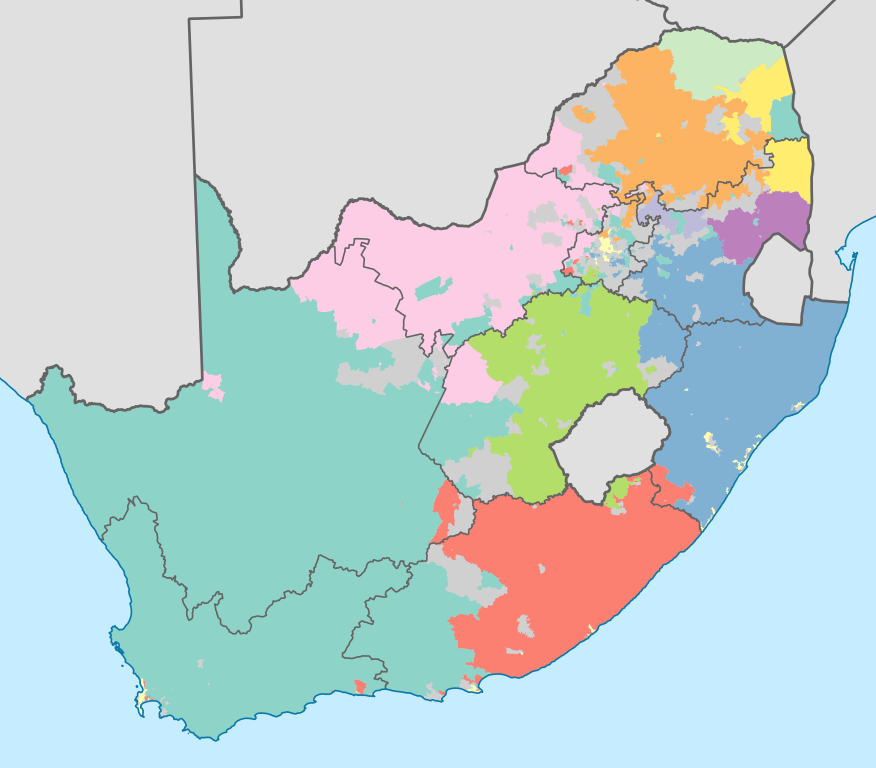
| Description | English: Map showing the dominant home languages in South Africa, based on ward-level data from the 2011 census. In this context, a language is dominant if it more than 50% of the population in a ward speak it at home, or more than 33% speak it and no other language is spoken by more than 25%. English Afrikaans isiNdebele isiXhosa isiZulu Sesotho sa Leboa Sesotho Setswana siSwati Tshivenda Xitsonga No language dominant Projection is Albers Equal-Area Conic, with standard parallels at 25.5° S and 31.5° S, and origin at 28.5° S 24.5° E. |
| Date | |
| Source | Statistics South Africa's Census 2011 is the source of the basic population data. The map results from my own processing of the data. For ward boundaries see File:South Africa electoral wards 2011 blank.svg. |
| Auteur | Htonl |
| Autres versions | South Africa 2011 dominant language map (hex cells).svg: .svg) |
Conditions d’utilisation
The following license applies to the population data on which the map is based:
 | Le détenteur des droits d’auteur de ce fichier, Stats SA, autorise n’importe qui à l’utiliser pour n’importe quelle utilisation, pourvu que le détenteur des droits d’auteur soit correctement attribué. La redistribution, les œuvres dérivées, l’utilisation commerciale et toutes les autres utilisations sont autorisées. |
Attribution: "the user acknowledges Stats SA as the source of the basic data wherever they process, apply, utilise, publish or distribute the data, and also that they specify that the relevant application and analysis (where applicable) result from their own processing of the data" [1]
|
The following tag applies to the map itself:
| Moi, propriétaire des droits d’auteur sur cette œuvre, la place dans le domaine public. Ceci s'applique dans le monde entier. Dans certains pays, ceci peut ne pas être possible ; dans ce cas : J’accorde à toute personne le droit d’utiliser cette œuvre dans n’importe quel but, sans aucune condition, sauf celles requises par la loi. |
Historique du fichier
Cliquer sur une date et heure pour voir le fichier tel qu'il était à ce moment-là.
| Date et heure | Vignette | Dimensions | Utilisateur | Commentaire | |
|---|---|---|---|---|---|
| actuel | 18 novembre 2012 à 23:09 | | 809 × 709 (798 kio) | Htonl | =={{int:filedesc}}== {{Information |Description={{en|1=Map showing the dominant home languages in South Africa, based on ward-level data from the 2011 census. In this context, a language is dominant if it more than 50% of the population in a ward speak... |
Utilisation du fichier
Les 5 pages suivantes utilisent ce fichier :
Usage global du fichier
Les autres wikis suivants utilisent ce fichier :
- Utilisation sur af.wikipedia.org
- Utilisation sur cs.wikipedia.org
- Utilisation sur de.wikipedia.org
- Utilisation sur dsb.wikipedia.org
- Utilisation sur en.wikipedia.org
- Utilisation sur eo.wikipedia.org
- Utilisation sur frr.wikipedia.org
- Utilisation sur fr.wiktionary.org
- Utilisation sur he.wikipedia.org
- Utilisation sur it.wikipedia.org
- Utilisation sur ka.wikipedia.org
- Utilisation sur ko.wikipedia.org
- Utilisation sur lb.wikipedia.org
- Utilisation sur ml.wikipedia.org
- Utilisation sur mzn.wikipedia.org
- Utilisation sur no.wikipedia.org
- Utilisation sur pt.wikipedia.org
- Utilisation sur rm.wikipedia.org
- Utilisation sur ro.wikipedia.org
- Utilisation sur ru.wikipedia.org
- Utilisation sur sh.wikipedia.org
- Utilisation sur simple.wikipedia.org
- Utilisation sur sr.wikipedia.org
- Utilisation sur ss.wikipedia.org
- Utilisation sur sv.wikipedia.org
- Utilisation sur sw.wikipedia.org
- Utilisation sur szl.wikipedia.org
- Utilisation sur te.wikipedia.org
- Utilisation sur tg.wikipedia.org
- Utilisation sur tr.wikipedia.org
- Utilisation sur uk.wikipedia.org
- Utilisation sur xh.wikipedia.org
- Utilisation sur zh.wikipedia.org
- Utilisation sur zu.wikipedia.org