پرونده:MS in Iran 2008-2015.svg


حجم پیشنمایش PNG این SVG file:۷۲۰ × ۵۴۰ پیکسل کیفیتهای دیگر: ۳۲۰ × ۲۴۰ پیکسل | ۶۴۰ × ۴۸۰ پیکسل | ۱٬۰۲۴ × ۷۶۸ پیکسل | ۱٬۲۸۰ × ۹۶۰ پیکسل | ۲٬۵۶۰ × ۱٬۹۲۰ پیکسل.
پروندهٔ اصلی (پروندهٔ اسویجی، با ابعاد ۷۲۰ × ۵۴۰ پیکسل، اندازهٔ پرونده: ۳۲ کیلوبایت)
این پرونده در ویکیانبار موجود است. محتویات صفحهٔ توصیف آن در زیر نمایش داده میشود. |
خلاصه
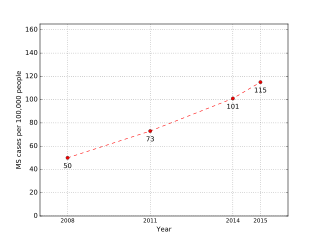
| توضیح | فارسی: شمار موارد شناساییشده از بیماری اماس در ایران. ایران از نظر شیوع این بیماری رتبهٔ اول را در خاورمیانه دارد و آمار نشان میدهد موارد ابتلا به این بیماری در حال افزایش است. |
| تاریخ | |
| منبع | اثر شخصی |
| پدیدآور | Dalba |
اجازهنامه
من، صاحب حقوق قانونی این اثر، به این وسیله این اثر را تحث اجازهنامهٔ ذیل منتشر میکنم:
این پرونده تحت پروانهٔ Creative Commons Attribution-Share Alike 4.0 International منتشر شده است.
- شما اجازه دارید:
- برای به اشتراک گذاشتن – برای کپی، توزیع و انتقال اثر
- تلفیق کردن – برای انطباق اثر
- تحت شرایط زیر:
- انتساب – شما باید اعتبار مربوطه را به دست آورید، پیوندی به مجوز ارائه دهید و نشان دهید که آیا تغییرات ایجاد شدهاند یا خیر. شما ممکن است این کار را به هر روش منطقی انجام دهید، اما نه به هر شیوهای که پیشنهاد میکند که مجوزدهنده از شما یا استفادهتان حمایت کند.
- انتشار مشابه – اگر این اثر را تلفیق یا تبدیل میکنید، یا بر پایه آن اثری دیگر خلق میکنید، میبایست مشارکتهای خود را تحت مجوز یکسان یا مشابه با ا اصل آن توزیع کنید.
Source
#!/usr/bin/env python """Prevalence of MS in Iran. Source of data: http://isna.ir/fa/news/95030301371/ """ import numpy as np import matplotlib.pyplot as plt years = (2008, 2011, 2014, 2015) per_100000 = (50, 73, 101, 115) ys = np.array(per_100000) xs = np.array(years) fig = plt.figure() ax = fig.add_subplot(111) axistexts = ax.set_xticklabels([str(x) for x in xs]) plt.setp(axistexts, fontsize=10, clip_on=False) plt.tick_params( axis='x', # changes apply to the x-axis which='both', # both major and minor ticks are affected bottom='off', # ticks along the bottom edge are off top='off', # ticks along the top edge are off labelbottom='on' # labels along the bottom edge are on ) plt.xlim(xs[0] - 1, xs[-1] + 1) plt.xticks(xs, xs) plt.xlabel('Year') plt.ylim(0, max(ys) + min(ys)) plt.yticks() plt.ylabel('MS cases per 100,000 people') plt.plot(xs, ys, '--ro') plt.grid(True) for x, y in zip(xs, ys): plt.text(x, y - 10, str(y), ha='center', va='bottom') plt.savefig('MS_in_Iran_2008-2015.svg') plt.show() تاریخچهٔ پرونده
روی تاریخ/زمانها کلیک کنید تا نسخهٔ مربوط به آن هنگام را ببینید.
| تاریخ/زمان | بندانگشتی | ابعاد | کاربر | توضیح | |
|---|---|---|---|---|---|
| کنونی | ۲۵ مهٔ ۲۰۱۶، ساعت ۰۴:۴۶ | | ۷۲۰ در ۵۴۰ (۳۲ کیلوبایت) | Dalba | User created page with UploadWizard |
کاربرد پرونده
صفحهٔ زیر از این تصویر استفاده میکند: