United States drug overdose death rates and totals over time

From Wikipedia the free encyclopedia

Fentanyl. 2 mg (white powder to the right) is a lethal dose in most people.[1][2] US penny is 19 mm (0.75 in) wide.

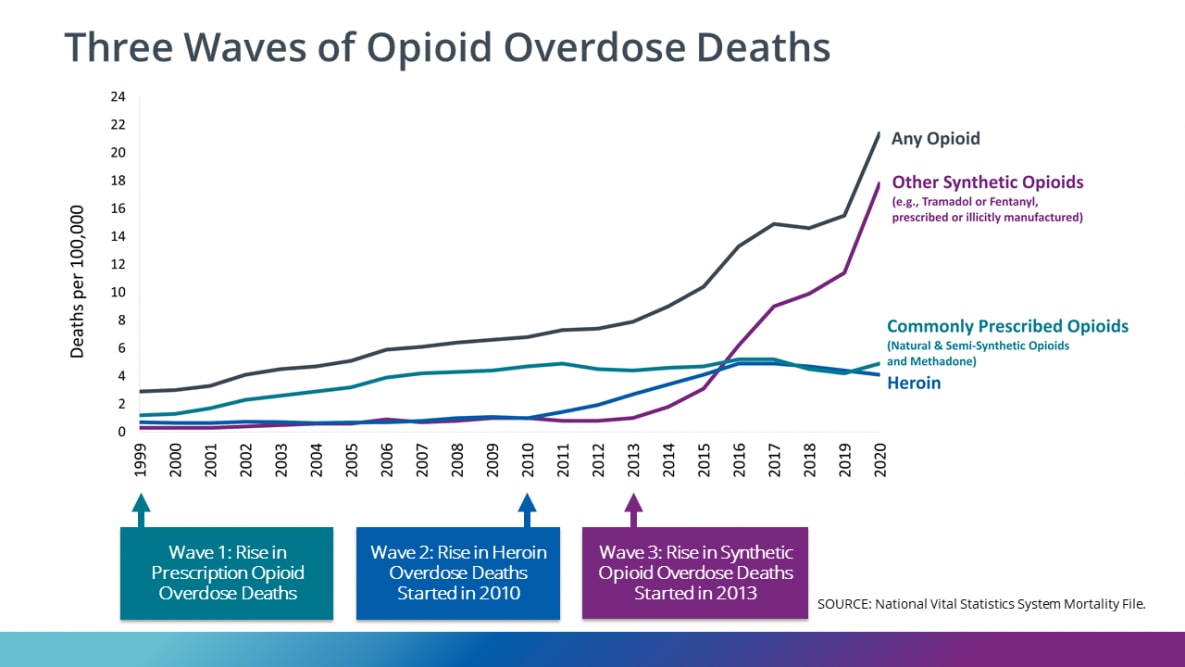
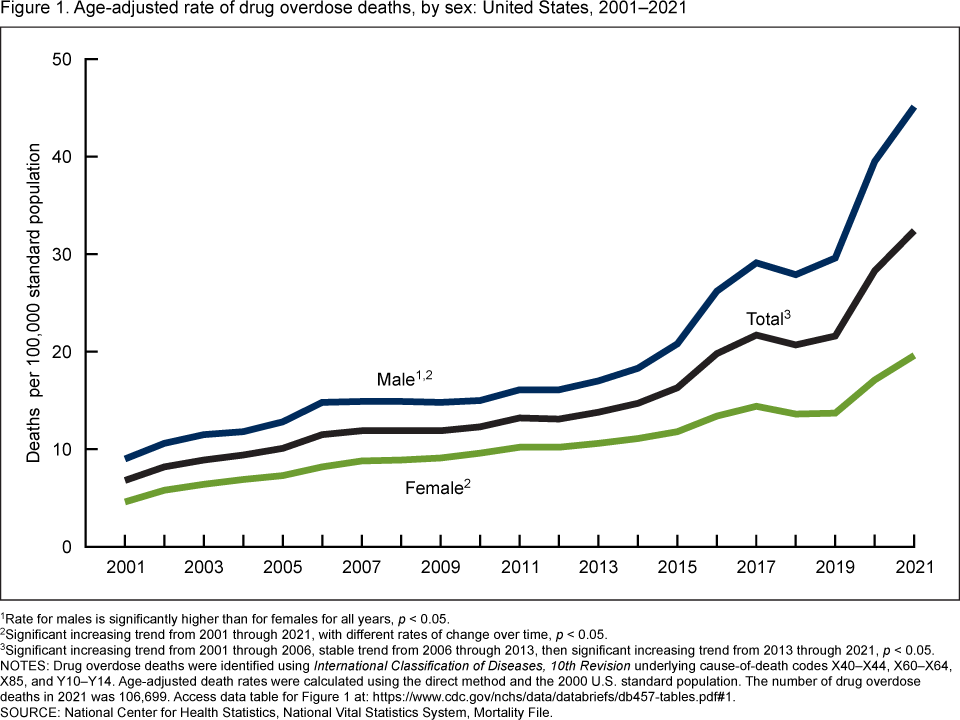
The United States Centers for Disease Control and Prevention has data on drug overdose death rates and totals. Around 1,106,900 US residents died from drug overdoses from 1968 to 2020, around 932,400 from 1999 through 2020 and around 91,800 in 2020. Of every 100,000 people in 2020 in the US, drugs killed 28. Opioids were involved in around 80,400 of the around 106,700 deaths in 2021. Synthetic opioids other than methadone (primarily fentanyl) were involved with 70,601 deaths in 2021.[3][4][5]

Around 110,800 people died in 2022. Around 112,100 people died in the 12-month period ending August 31, 2023, at a rate of 307 deaths per day. That is 34 deaths per 100,000 US residents, using the population at the midpoint of that period.[6][7]

1968–2021[edit]

U.S. yearly overdose deaths from all drugs.[8]

The numbers at the source for the table below are continually updated. So the numbers in the table below may be slightly different.[3] 2021 was a turning point in US history with over 100,000 deaths.[9]

  • Rates below are per 100,000.

Rate map and timeline by state[edit]

Drug overdose deaths in the US per 100,000 people by state.[4][5]

Asterisks (*) indicate Health in STATE or Healthcare in STATE links in table below.

By state over time[edit]

Overall US totals by year, followed by breakdown by state by year.[4]

States 1999 2005 2014 2015 2016
Deaths 16,801 29,736 46,959 52,279 63,363
States 2017 2018 2019 2020 2021
Deaths 69,927 67,113 70,319 91,375 106,249

State links below are "Category:Health in STATE" links. See overall category.

Timeline by drug[edit]

Concerning the data in the charts below (in this section and the following sections) deaths from the various drugs add up to more than the yearly overdose death total because multiple drugs are involved in many of the deaths.[8]

US yearly overdose deaths, and the drugs involved.[8]

Opioid charts[edit]

A two milligram dose of fentanyl powder (on pencil tip) is a lethal amount for most people.[10]

Opioids were involved in around 80,400 of the around 106,700 deaths in 2021.[8] See map higher up for states with the highest overdose death rates.

Three waves of opioid overdose deaths.[11]
U.S. overdose deaths involving all opioids. Deaths per 100,000 population.[12]
US yearly deaths from all opioid drugs. Included in this number are opioid analgesics, along with heroin and illicit synthetic opioids.[8]
US yearly deaths involving other synthetic opioids, predominately Fentanyl.[8]
US yearly deaths involving prescription opioids. Non-methadone synthetics is a category dominated by illegally acquired fentanyl, and has been excluded.[8]
US overdose deaths involving heroin, by other opioid involvement.[8]
Timeline of US overdose deaths involving stimulants (cocaine and psychostimulants), by opioid involvement.[8]
US overdose deaths involving psychostimulants with abuse potential (primarily methamphetamine), by opioid involvement.
Opioid involvement in cocaine overdose deaths.[8]
The top line represents the yearly number of benzodiazepine deaths that involved opioids in the US. The bottom line represents benzodiazepine deaths that did not involve opioids.[8]
Drug overdose deaths involving antidepressants, by opioid involvement.[8]

Rate timeline by race and ethnicity[edit]

Timeline of US drug overdose death rates by race and ethnicity.[13] Rate per 100,000 population.

Rate timeline by sex[edit]

Timeline of US drug overdose death rates by sex,[14] Rate per 100,000 population.

Comparisons to other countries in Europe[edit]

There were around 68,700 drug overdose deaths in the United States in 2018. That is a rate of 210 deaths per million residents.[6][7] Compare that rate to the 2018 rates of the European countries in the first chart below.

Drug overdose death rates for European countries.[15][16]
  • Row numbers below are static. Other columns are sortable. This allows ranking of any column.
  • Location links below are "Healthcare in LOCATION" links.

See also[edit]

References[edit]

  1. ^ Fentanyl. Image 4 of 17. US DEA (Drug Enforcement Administration). See archive with caption: "photo illustration of 2 milligrams of fentanyl, a lethal dose in most people".
  2. ^ Facts About Fentanyl. From US Drug Enforcement Administration.
  3. ^ a b c Data is from these saved tables from CDC Wonder at the Centers for Disease Control and Prevention, National Center for Health Statistics. The tables have totals, rates, and US populations per year. The numbers are continually updated: "This dataset has been updated since this request was saved, which could lead to differences in results." So the numbers in the table at the source may be slightly different.
  4. ^ a b c d e Drug Overdose Mortality by State. Pick year from menu below map. From National Center for Health Statistics for the Centers for Disease Control and Prevention. The numbers are in the data table below the map, and by running your cursor over the map at the source. CSV data link below table.
  5. ^ a b Death Rate Maps & Graphs | Drug Overdose. Centers for Disease Control and Prevention, National Center for Injury Prevention and Control. Click on a map year. The data table is below the map. Number of deaths for each state, and the age-adjusted rates of death for each state. Also, place cursor on map states to get data.
  6. ^ a b Products - Vital Statistics Rapid Release - Provisional Drug Overdose Data. Centers for Disease Control and Prevention. Hover cursor over the end of the graph in Figure 1A to get the latest number. Scroll down the page and click on the dropdown data table called "Data Table for Figure 1a. 12 Month-ending Provisional Counts of Drug Overdose Deaths". The number used is the "predicted value" for the 12 month period that is ending at the end of that month. That number changes as more info comes in. If there are problems use a different browser.
  7. ^ a b US Population by Month. US resident population. Source: US Census Bureau. Population from the middle of the 12-month period is used to calculate the death rate. See WP:CALC.
  8. ^ a b c d e f g h i j k l Drug Overdose Death Rates. By National Institute on Drug Abuse (NIDA). See "Download Links" section near the bottom of the page for the latest data link, and a PowerPoint link.
  9. ^ Yousif, Nadine (September 17, 2023). "How the fentanyl crisis' fourth wave has hit every corner of the US". BBC News.
  10. ^ "One Pill Can Kill". US Drug Enforcement Administration. Archived from the original on 15 Nov 2023. Retrieved 15 Nov 2023.
  11. ^ Understanding the Opioid Overdose Epidemic. See large image. Centers for Disease Control and Prevention.
  12. ^ Opioid Data Analysis and Resources. Drug Overdose. CDC Injury Center. Centers for Disease Control and Prevention. Click on "Rising Rates" tab for a graph. See the data table below the graph.
  13. ^ NCHS Data Visualization Gallery - Drug Poisoning Mortality. From National Center for Health Statistics. Open the dashboard dropdown menu and pick "U.S. Trends". From the menus on the right pick all races, all ages, and both sexes. Run your cursor over the graph to see the data.
  14. ^ Drug Overdose Deaths in the United States, 2001–2021. NCHS Data Brief No. 457, December 2022.. From National Center for Health Statistics. Scroll down to Figure 1. Right-click the image, and then click "Open link in new tab" to get the larger PNG image. 2001-2021 chart.
  15. ^ Lowther, Ed; Brocklehurst, Steven. (15 December 2020). Scotland's drug death crisis in six charts. BBC News. Data sources listed are EMCDDA (European Monitoring Centre for Drugs and Drug Addiction) and National Records of Scotland.
  16. ^ a b Statistical Bulletin 2023 — drug-induced deaths. See table of yearly drug deaths by country there. From European Monitoring Centre for Drugs and Drug Addiction (EMCDDA).

Further reading[edit]