Health in England
 From Wikipedia the free encyclopedia
Health in England refers to the overall health of the population of England. The average life expectancy is 77.5 years for males and 81.7 years for females, the highest of the four countries of the United Kingdom.[1] The south of England has a higher life expectancy than the north, but regional differences seem to be slowly narrowing: between 1991–1993 and 2012–2014, life expectancy in the North East increased by 6.0 years and in the North West by 5.8 years.[1][2]
The Blair Government instituted a comprehensive programme to reduce health inequalities in England between 1997 and 2010 focused on reducing geographical inequalities in life expectancy. It was targeted at the Spearhead areas - the 20% of local authorities with the worst health and deprivation indicators. This led to more NHS resources being directed to the most deprived areas. The strategy was associated with a decline in geographical inequalities in life expectancy, reversing a trend which had increased over a long period.[3] In 2014 to 2016, the difference in life expectancy between the most and least deprived areas of England was 9.3 years for males and 7.3 years for females.[4]
Life expectancy[edit]

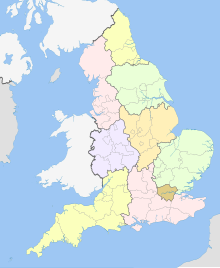
A North-South divide in life expectancy continues to be apparent. In 2016 to 2018, this geographical divide can be seen across regions of England. The life expectancy at birth of males and females in the regions of London, the South East, South West and East of England were all significantly higher than the national average. Whereas, life expectancy was lowest in the North East, North West and Yorkshire and the Humber.
On average, there have been reductions in the number of years lived in poorer states of health for both men and women at age 65 in England. As of 2018, Richmond-upon-Thames had the highest male healthy life expectancy at birth in the UK of 71.9 years, 18.6 years longer than males in Blackpool where it was only 53.3 years. For females, the lowest healthy life expectancy at birth was found in Nottingham at 54.2 years, and the highest was in Wokingham at 72.2 years, a gap of 18 years.[5]
| Male | Female | |
|---|---|---|
| England | 79.6 | 83.2 |
| North East | 77.9 | 81.7 |
| North West | 78.3 | 81.9 |
| Yorkshire and the Humber | 78.7 | 82.4 |
| East Midlands | 79.4 | 82.9 |
| West Midlands | 78.9 | 82.7 |
| East | 80.3 | 83.7 |
| London | 80.7 | 84.5 |
| South East | 80.7 | 84.1 |
| South West | 80.2 | 83.8 |
The ten leading causes of death for men in England are heart disease, dementia and Alzheimer's disease, lung cancer, chronic lower respiratory diseases, stroke, influenza and pneumonia, prostate cancer, colorectal cancer, leukemia and diseases of the liver, respectively.
In females, the leading cause of death is dementia and Alzheimer's disease followed by heart disease, stroke, chronic lower respiratory diseases, influenza and pneumonia, lung cancer, breast cancer, colorectal cancer, leukemia and kidney disease. Higher mortality rates for heart disease, lung cancer, and chronic lower respiratory diseases in the most deprived areas contribute the most to the life expectancy gap. Smoking and obesity are the main risk factors for these diseases.[7]
Vaccinations[edit]
In the England, the purchase and distribution of vaccines is managed centrally, and recommended vaccines are provided for free by the NHS.[8]
Risk factors[edit]
The prevalence of many risk factors, including smoking, drug use, high blood pressure and high cholesterol have declined. The smoking rate was down to 30% by the early-1990s, 21% by 2010, and 19.3% by 2013, the lowest level for eighty years.[9] In 2015, smoking rates in England had fallen to 16.9%.[10] England is working towards a smoke-free generation.[11]
However, there has been an increase in the prevalence of obesity. In England, in 2016, 26.2% of adults were obese and it is forecast that levels of obesity will increase. The heaviest-drinking 20% of the population drink almost two thirds of all alcohol consumed.[12]
See also[edit]
- National Health Service
- Healthcare in England
- Health in the United Kingdom
- Health Survey for England
- Royal Society for Public Health
- UK Health Security Agency
- Office for Health Improvement and Disparities
References[edit]
- ^ a b Office for National Statistics. "Life expectancy". statistics.gov.uk. Archived from the original on 25 May 2009. Retrieved 20 July 2009.
- ^ "Health state life expectancies by national deprivation deciles, England: 2016 to 2018". Office for National Statistics. 27 March 2020. Retrieved 1 October 2020.
- ^ Barr, Ben; Higgerson, James; Whitehead, Margaret (5 July 2017). "Investigating the impact of the English health inequalities strategy: time trend analysis". British Medical Journal. 358: j3310. doi:10.1136/bmj.j3310. PMC 5527348. PMID 28747304. Retrieved 24 August 2017.
- ^ "Health Profile for England: 2018". Public Health England. 11 September 2018. Retrieved 1 October 2020.
- ^ "Health state life expectancies, UK: 2016 to 2018". Office for National Statistics. 11 December 2019. Retrieved 1 October 2020.
- ^ "Health state life expectancies, UK: 2016 to 2018". Office for National Statistics. 11 December 2019. Retrieved 1 October 2020.
- ^ "Health Profile for England: 2018". Public Health England. 11 September 2018. Retrieved 1 October 2020.
- ^ Freed GL (2005). "Vaccine policies across the pond: looking at the U.K. and U.S. systems". Health Affairs. 24 (3): 755–7. doi:10.1377/hlthaff.24.3.755. PMID 15886170.
- ^ "Ministers aim to halve number of people smoking by 2020". BBC News. 1 February 2010. Retrieved 4 April 2014.
- ^ "Smoking rates in England fall to lowest on record". BBC News. 20 September 2016.
- ^ "Stopping the start: our new plan to create a smokefree generation". GOV.UK. 2023-10-12. Retrieved 2023-10-30.
- ^ "Health at a Glance 2015 How does the United Kingdom compare?" (PDF). OECD. 2015. Retrieved 24 August 2017.