Hampshire County Council elections
 From Wikipedia the free encyclopedia
Hampshire County Council in England is elected every four years. Since the boundary changes in 2005, 78 councillors have been elected from 75 wards, with further boundary changes in 2017.[1][2]
Council elections[edit]
- 2001 Hampshire County Council election
- 2005 Hampshire County Council election (boundary changes increased the number of seats by 2)[3]
- 2009 Hampshire County Council election
- 2013 Hampshire County Council election
- 2017 Hampshire County Council election (boundary changes)
- 2021 Hampshire County Council election
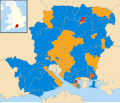
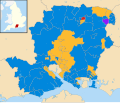
County result maps[edit]
By-election results[edit]
1997–2001[edit]
| Party | Candidate | Votes | % | ±% | |
|---|---|---|---|---|---|
| Liberal Democrats | 1,674 | 48.7 | +6.0 | ||
| Conservative | 1,628 | 47.3 | +1.8 | ||
| Labour | 138 | 4.0 | -7.8 | ||
| Majority | 46 | 1.4 | |||
| Turnout | 3,440 | 22.0 | |||
| Liberal Democrats gain from Conservative | Swing | ||||
| Party | Candidate | Votes | % | ±% | |
|---|---|---|---|---|---|
| Conservative | 742 | 43.2 | +5.9 | ||
| Labour | 564 | 32.8 | -2.4 | ||
| Liberal Democrats | 347 | 20.2 | -5.2 | ||
| Independent | 64 | 3.7 | +3.7 | ||
| Majority | 178 | 10.4 | |||
| Turnout | 1,717 | 16.5 | |||
| Conservative hold | Swing | ||||
| Party | Candidate | Votes | % | ±% | |
|---|---|---|---|---|---|
| Conservative | 741 | 47.3 | +10.9 | ||
| Liberal Democrats | 554 | 35.4 | +5.5 | ||
| Labour | 270 | 17.3 | -12.8 | ||
| Majority | 187 | 11.9 | |||
| Turnout | 1,565 | 10.6 | |||
| Conservative hold | Swing | ||||
| Party | Candidate | Votes | % | ±% | |
|---|---|---|---|---|---|
| Labour | 1,107 | 51.1 | -3.4 | ||
| Conservative | 617 | 28.5 | +2.6 | ||
| Liberal Democrats | 443 | 20.4 | +1.8 | ||
| Majority | 490 | 22.6 | |||
| Turnout | 2,167 | 20.2 | |||
| Conservative hold | Swing | ||||
| Party | Candidate | Votes | % | ±% | |
|---|---|---|---|---|---|
| Conservative | John Stocks | 1,044 | 63.9 | +28.2 | |
| Liberal Democrats | Helen Alley | 373 | 22.8 | +8.0 | |
| Labour | Peter Cotton | 217 | 13.3 | +6.5 | |
| Majority | 671 | 41.1 | |||
| Turnout | 1,634 | 13.8 | |||
| Conservative gain from Independent | Swing | ||||
2001–2005[edit]
| Party | Candidate | Votes | % | ±% | |
|---|---|---|---|---|---|
| Labour | 1,606 | 68.3 | +11.9 | ||
| Conservative | 639 | 27.2 | -6.2 | ||
| Liberal Democrats | 107 | 4.5 | -5.7 | ||
| Majority | 967 | 41.1 | |||
| Turnout | 2,352 | 21.7 | |||
| Labour hold | Swing | ||||
| Party | Candidate | Votes | % | ±% | |
|---|---|---|---|---|---|
| Liberal Democrats | John Shaw | 1,223 | 38.6 | +11.8 | |
| Conservative | Harry Robinson | 1,126 | 35.5 | +4.2 | |
| Labour | Julie Johnson | 824 | 26.0 | -15.9 | |
| Majority | 98 | 3.1 | |||
| Turnout | 3,174 | 28.5 | |||
| Liberal Democrats gain from Labour | Swing | ||||
| Party | Candidate | Votes | % | ±% | |
|---|---|---|---|---|---|
| Liberal Democrats | Lee Dunsdon | 1,796 | 66.9 | +21.0 | |
| Conservative | Alexis McEvoy | 801 | 29.8 | -7.7 | |
| Labour | Alan Goodfellow | 87 | 3.2 | -13.5 | |
| Majority | 995 | 37.1 | |||
| Turnout | 2,684 | 25.0 | |||
| Liberal Democrats hold | Swing | ||||
| Party | Candidate | Votes | % | ±% | |
|---|---|---|---|---|---|
| Liberal Democrats | Ann Buckley | 978 | 56.6 | +36.2 | |
| Labour | 433 | 25.0 | -31.0 | ||
| Conservative | 285 | 16.5 | -7.0 | ||
| Green | 33 | 1.9 | +1.9 | ||
| Majority | 545 | 31.6 | |||
| Turnout | 1,729 | 17.2 | |||
| Liberal Democrats gain from Labour | Swing | ||||
2009–2013[edit]
| Party | Candidate | Votes | % | ±% | |
|---|---|---|---|---|---|
| Conservative | David Drew | 1,183 | 42.7 | -6.4 | |
| Liberal Democrats | Maureen Comber | 1,111 | 40.1 | +17.7 | |
| Labour | John Newland | 245 | 8.8 | +1.7 | |
| UKIP | Anthony McCabe | 233 | 8.4 | -13.0 | |
| Majority | 72 | 2.6 | |||
| Turnout | 2,772 | ||||
| Conservative hold | Swing | ||||
| Party | Candidate | Votes | % | ±% | |
|---|---|---|---|---|---|
| Conservative | Graham Burgess | 3,080 | 59.6 | -6.3 | |
| Liberal Democrats | Angela Whitbread | 1,227 | 23.8 | -2.0 | |
| Labour | Graham Giles | 858 | 16.6 | +8.3 | |
| Majority | 1,853 | 35.9 | |||
| Turnout | 5,165 | ||||
| Conservative hold | Swing | ||||
| Party | Candidate | Votes | % | ±% | |
|---|---|---|---|---|---|
| Conservative | Ferris Cowper | 1,588 | 64.6 | +0.9 | |
| Liberal Democrats | Maureen Comber | 290 | 11.8 | -19.3 | |
| Labour | John Tough | 258 | 10.5 | +5.3 | |
| Green | Neville Taylor | 178 | 7.2 | +7.2 | |
| Justice & Anti-Corruption | Don Jerrard | 146 | 5.9 | +5.9 | |
| Majority | 1,298 | 52.8 | |||
| Turnout | 2,460 | ||||
| Conservative hold | Swing | ||||
| Party | Candidate | Votes | % | ±% | |
|---|---|---|---|---|---|
| Conservative | Patricia Stallard | 1,661 | 53.8 | -3.9 | |
| Liberal Democrats | Vivian Achwal | 1,038 | 33.6 | +6.5 | |
| UKIP | Stephen Harris | 133 | 4.3 | -7.9 | |
| Green | John Vivian | 130 | 4.2 | +4.2 | |
| Labour | David Picton-Jones | 124 | 4.0 | +0.9 | |
| Majority | 623 | 20.2 | |||
| Turnout | 3,086 | ||||
| Conservative hold | Swing | ||||
2013–2017[edit]
| Party | Candidate | Votes | % | ±% | |
|---|---|---|---|---|---|
| Conservative | Ken Moon | 1,156 | 37.3 | -1.4 | |
| UKIP | David Alexander | 720 | 23.2 | +0.7 | |
| Liberal Democrats | Richard Robinson | 685 | 22.1 | +1.1 | |
| Labour | Bill Organ | 322 | 10.4 | +1.2 | |
| Green | Adam Harper | 220 | 7.1 | -1.5 | |
| Majority | 436 | 14.1 | |||
| Turnout | 3,103 | ||||
| Conservative hold | Swing | ||||
| Party | Candidate | Votes | % | ±% | |
|---|---|---|---|---|---|
| Conservative | Zilliah Brooks | 5,208 | 57.5 | +11.9 | |
| UKIP | Christine Forrester | 1,846 | 20.4 | -18.0 | |
| Labour | Michael Mumford | 1,304 | 14.4 | +5.0 | |
| Green | Dean Marriner | 698 | 7.7 | +7.7 | |
| Majority | 3,362 | 37.1 | |||
| Turnout | 9,056 | ||||
| Conservative hold | Swing | ||||
| Party | Candidate | Votes | % | ±% | |
|---|---|---|---|---|---|
| Conservative | Judith Grajewski | 2,074 | 49.3 | +10.2 | |
| Liberal Democrats | James Duguid | 1,493 | 35.5 | +3.8 | |
| UKIP | John Edwards | 358 | 8.5 | -13.3 | |
| Labour | Sarah Smith | 285 | 6.8 | +2.0 | |
| Majority | 581 | 13.8 | |||
| Turnout | 4,210 | ||||
| Conservative hold | Swing | ||||
| Party | Candidate | Votes | % | ±% | |
|---|---|---|---|---|---|
| Conservative | Christopher Matthews | 4,408 | 41.9 | +9.4 | |
| UKIP | Paul Sturgess | 2,164 | 20.6 | -8.6 | |
| Liberal Democrats | Peter Trott | 1,905 | 18.1 | -5.4 | |
| Labour | James Carr | 1,360 | 12.9 | +3.6 | |
| Green | David Harrison | 673 | 6.4 | +0.9 | |
| Majority | 2,244 | 21.4 | |||
| Turnout | 10,510 | ||||
| Conservative hold | Swing | ||||
| Party | Candidate | Votes | % | ±% | |
|---|---|---|---|---|---|
| Conservative | Floss Mitchell | 2,201 | 51.0 | -6.0 | |
| Liberal Democrats | Trevor Maroney | 1,321 | 30.6 | +20.6 | |
| UKIP | Peter Baillie | 791 | 18.3 | -5.7 | |
| Majority | 880 | 20.4 | |||
| Turnout | 4,313 | ||||
| Conservative hold | Swing | ||||
2021–2025[edit]
| Party | Candidate | Votes | % | ±% | |
|---|---|---|---|---|---|
| Conservative | Ryan Brent | 1,484 | 47.1 | -18.6 | |
| Liberal Democrats | Adrian Tansom | 866 | 27.5 | +17.8 | |
| Labour | Munazza Faiz | 802 | 25.4 | +9.3 | |
| Majority | 618 | 19.6 | |||
| Turnout | 3,152 | ||||
| Conservative hold | Swing | ||||
References[edit]
- ^ "County Council Elections". Hampshire County Council. Archived from the original on 26 July 2009. Retrieved 5 September 2009.
- ^ "LGBCE | Hampshire County Council | LGBCE Site". www.lgbce.org.uk. Retrieved 14 April 2020.
- ^ "Local election results: Hampshire". * BBC News Online. Retrieved 5 September 2009.
- ^ "By-Election November 2000". Hampshire County Council. Archived from the original on 8 August 2007. Retrieved 5 September 2009.
- ^ "Victory for Lib-Dems". Hampshire Chronicle. 10 February 2003. Retrieved 5 September 2009.
- ^ "Declaration of result of poll". New Forest District Council. Retrieved 5 September 2009.
- ^ "Lib Dems enjoy landslide". guardian.co.uk. 3 December 2004. Retrieved 5 September 2009.
- ^ "Local Elections Archive Project — Andover South Division". www.andrewteale.me.uk. Retrieved 20 March 2024.
- ^ "Local Elections Archive Project — Lee Division". www.andrewteale.me.uk. Retrieved 20 March 2024.
- ^ "Local Elections Archive Project — Headley Division". www.andrewteale.me.uk. Retrieved 20 March 2024.
- ^ "Local Elections Archive Project — Winchester Southern Parishes Division". www.andrewteale.me.uk. Retrieved 20 March 2024.
- ^ "Local Elections Archive Project — Petersfield Butser Division". www.andrewteale.me.uk. Retrieved 20 March 2024.
- ^ "Local Elections Archive Project — Andover West Division". www.andrewteale.me.uk. Retrieved 20 March 2024.
- ^ "Local Elections Archive Project — Chandler's Ford Division". www.andrewteale.me.uk. Retrieved 20 March 2024.
- ^ "Local Elections Archive Project — Fareham Town Division". www.andrewteale.me.uk. Retrieved 20 March 2024.
- ^ "Local Elections Archive Project — Headley Division". www.andrewteale.me.uk. Retrieved 20 March 2024.
- ^ "Local Elections Archive Project — Purbrook and Stakes South Division". www.andrewteale.me.uk. Retrieved 20 March 2024.
- Hampshire election results
- By-election results Archived 29 March 2010 at the Wayback Machine


