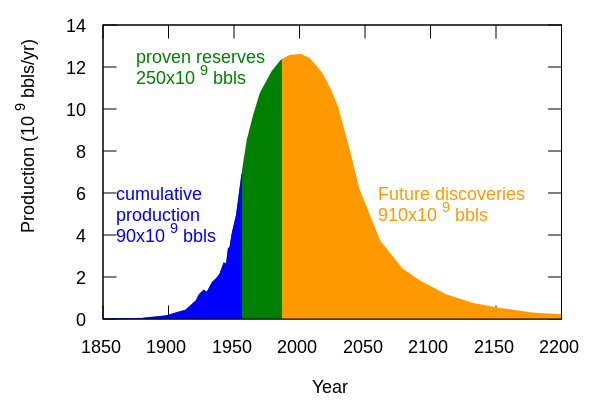
File:Hubbert peak oil plot.svg
 From Wikipedia the free encyclopedia

Original file (SVG file, nominally 600 × 400 pixels, file size: 10 KB)
File history
Click on a date/time to view the file as it appeared at that time.
| Date/Time | Thumbnail | Dimensions | User | Comment | |
|---|---|---|---|---|---|
| current | 14:35, 11 January 2009 |  | 600 × 400 (10 KB) | Hankwang | Update after comments - Same license as before |
| 16:56, 11 June 2008 |  | 600 × 400 (8 KB) | File Upload Bot (Magnus Manske) | {{BotMoveToCommons|en.wikipedia}} {{Information |Description={{en|New presentation of data in figure 20 of http://www.hubbertpeak.com/hubbert/1956/1956.pdf . Meant as replacement for non-free [[:en::Image:Hubbert-fig-20.png]]. == Data == Data file "hcu |
File usage
- 1980s oil glut
- 2000s energy crisis
- A Crude Awakening: The Oil Crash
- A Green New Deal
- Albert Allen Bartlett
- Ali Morteza Samsam Bakhtiari
- Andrew McNamara
- Arctic Refuge drilling controversy
- Beyond Oil
- Colin Campbell (geologist)
- Collapse (film)
- David Goodstein
- Energy Victory
- Energy crisis
- Energy descent
- Energy law
- Energy supply
- Escape from Suburbia
- Export Land Model
- Fossil fuel phase-out
- Fuel (film)
- GasHole
- Giant oil and gas fields
- Global catastrophe scenarios
- Global energy crisis (2021–present)
- Green Revolution
- Hirsch report
- Hubbert peak theory
- James Howard Kunstler
- Jean Laherrère
- Jeremy Leggett
- John Michael Greer
- Julian Darley
- Kenneth Hsu
- Kenneth S. Deffeyes
- M. King Hubbert
- Matthew Simmons
- Michael Klare
- Michael Ruppert
- Nationalization of oil supplies
- Oil 101
- Oil Depletion Analysis Centre
- Oil Shockwave
- Oil depletion
- Out of Gas: The End of the Age of Oil
- Peak car
- Peak oil
- Peak wheat
- PetroApocalypse Now?
- Petroleum politics
- Pickens Plan
- Post Carbon Institute
- Predicting the timing of peak oil
- Richard Heinberg
- Richard Rainwater
- Rimini protocol
- Robert L. Hirsch
- Roscoe Bartlett
- Simple living
- Sustainability measurement
- The Carbon War
- The End of Oil
- The End of Suburbia
- The Frackers
- The Long Emergency
- The Oil Drum
- The Oil Factor
- The Party's Over: Oil, War, and the Fate of Industrial Societies
- The Power of Community: How Cuba Survived Peak Oil
- Transition town
- Twilight in the Desert
- United States offshore drilling debate
- Vern Ehlers
- What a Way to Go: Life at the End of Empire
- Willow project
- Talk:Peak oil/sandbox
- Talk:Sustainability/History/Archive 3
- Talk:Sustainability/History/Archive 4
- User:Hankwang/Images
- User:Kgrr/Sandbox/Peak oil
- User:Klivian
- User:Marian Sokolski/sandbox
- User:NickCT
- User:NickCT/Peak Oil
- User:Spasemunki/olduvia
- User:Teratornis/Blood and Oil
- User:YRUsoamazing
- Template:Peak oil
- Category:Peak oil books
Global file usage
The following other wikis use this file:
- Usage on ar.wikipedia.org
- Usage on ca.wikipedia.org
- Usage on de.wikipedia.org
- Usage on el.wikipedia.org
- Usage on eo.wikipedia.org
- Usage on es.wikipedia.org
- Usage on eu.wikipedia.org
- Usage on fa.wikipedia.org
- Usage on fi.wikipedia.org
- Usage on fr.wikipedia.org
- Usage on fr.wiktionary.org
- Usage on hy.wikipedia.org
- Usage on id.wikipedia.org
- Usage on it.wikipedia.org
- Usage on ko.wikipedia.org
- Usage on la.wikipedia.org
- Usage on ms.wikipedia.org
- Usage on nl.wikipedia.org
- Usage on pl.wikipedia.org
- Usage on pt.wikipedia.org
- Usage on ro.wikipedia.org
- Usage on ru.wikipedia.org
- Usage on simple.wikipedia.org
- Usage on ta.wikipedia.org
- Usage on th.wikipedia.org
- Usage on uk.wikipedia.org
View more global usage of this file.


