File:2008prescountymap.PNG
 From Wikipedia the free encyclopedia

Size of this preview: 800 × 520 pixels. Other resolutions: 320 × 208 pixels | 640 × 416 pixels | 1,024 × 665 pixels | 1,513 × 983 pixels.
Original file (1,513 × 983 pixels, file size: 176 KB, MIME type: image/png)
| This is a file from the Wikimedia Commons. Information from its description page there is shown below. Commons is a freely licensed media file repository. You can help. |
Summary
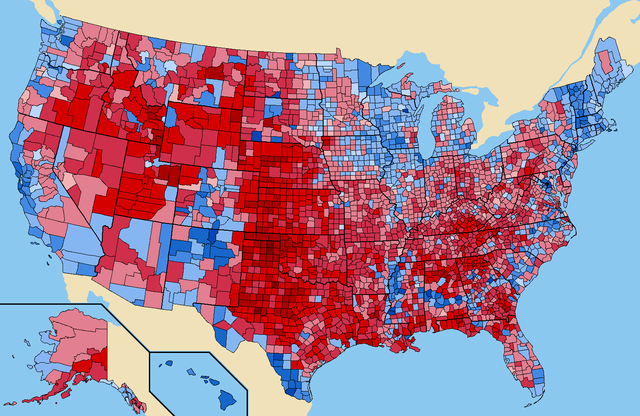
| Description | English: Popular vote by county. Red represents counties that went for McCain, Blue represents counties that went for Obama. Connecticut, Hawaii, Massachusetts, New Hampshire, Rhode Island, and Vermont had all counties go to Obama. Oklahoma had all counties go to McCain. |
| Date | |
| Source | Own work (Original caption: " Own work by uploader ")data, coloring, and inspiration from http://uselectionatlas.org |
| Author | Tilden76 at English Wikipedia |
| Other versions | File:2008 General Election Results by County.PNG |
Licensing
Tilden76 at English Wikipedia, the copyright holder of this work, hereby publishes it under the following license:
This file is licensed under the Creative Commons Attribution 3.0 Unported license.
Attribution: Tilden76 at English Wikipedia
- You are free:
- to share – to copy, distribute and transmit the work
- to remix – to adapt the work
- Under the following conditions:
- attribution – You must give appropriate credit, provide a link to the license, and indicate if changes were made. You may do so in any reasonable manner, but not in any way that suggests the licensor endorses you or your use.
Original upload log
Transferred from en.wikipedia to Commons by Magog the Ogre using CommonsHelper.
The original description page was here. All following user names refer to en.wikipedia.
- 2010-05-17 22:13 Tilden76 1513×983× (202512 bytes) North Dakota county fixed.
- 2010-03-08 04:42 Tilden76 1513×983× (202510 bytes) Utah county fixed.
- 2010-01-19 05:14 Tilden76 1513×983× (202768 bytes) {{Information |Description = {{en|1=Map showing the results by county of the 2008 United States presidential election specifically identifying the percentage recieved by the winning candidate in each county.}} |Source = Own work by uploader;
File history
Click on a date/time to view the file as it appeared at that time.
| Date/Time | Thumbnail | Dimensions | User | Comment | |
|---|---|---|---|---|---|
| current | 22:26, 23 December 2016 | | 1,513 × 983 (176 KB) | CourtlyHades296 | color correct to match svg |
| 14:37, 19 September 2016 |  | 1,513 × 983 (70 KB) | Mrsocial99mfine | Applied lossless compression using PNGGauntlet v3.1.2.0 | |
| 18:31, 12 October 2011 |  | 1,513 × 983 (198 KB) | OgreBot | (BOT): Uploading old version of file from en.wikipedia; originally uploaded on 2010-05-17 22:13:00 by Tilden76 | |
| 18:31, 12 October 2011 |  | 1,513 × 983 (198 KB) | OgreBot | (BOT): Uploading old version of file from en.wikipedia; originally uploaded on 2010-03-08 04:42:00 by Tilden76 | |
| 18:31, 12 October 2011 |  | 1,513 × 983 (198 KB) | OgreBot | (BOT): Uploading old version of file from en.wikipedia; originally uploaded on 2010-01-19 05:14:00 by Tilden76 | |
| 05:25, 4 December 2010 |  | 1,513 × 983 (198 KB) | File Upload Bot (Magnus Manske) | {{BotMoveToCommons|en.wikipedia|year={{subst:CURRENTYEAR}}|month={{subst:CURRENTMONTHNAME}}|day={{subst:CURRENTDAY}}}} {{Information |Description={{en|''no original description''}} |Source=Transferred from [http://en.wikipedia.org en.wikipedia]; transfer |
File usage
The following pages on the English Wikipedia use this file (pages on other projects are not listed):
Global file usage
The following other wikis use this file:
- Usage on fi.wikipedia.org
- Usage on id.wikipedia.org
- Usage on pt.wikipedia.org