Part of the 1985 Irish local elections
1985 Westmeath County Council election|
|
|
| |
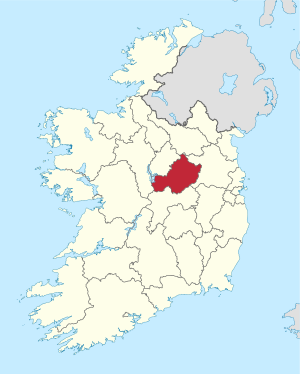 Map showing the area of Westmeath County Council |
Council control before election
Fianna Fáil
| Council control after election
Fianna Fáil
| |
An election to Westmeath County Council took place on 20 June 1985 as part of the Irish local elections. 23 councillors were elected from five local electoral areas (LEAs) for a five-year term of office on the electoral system of proportional representation by means of the single transferable vote (PR-STV). This term was extended for a further year, to 1991.[1]
Results by party[edit]
Results by local electoral area[edit]
Athlone[edit]
Athlone: 7 seats | Party | Candidate | FPv% | Count |
| 1 | 2 | 3 | 4 | 5 | 6 | 7 | 8 | 9 | 10 | 11 | 12 | 13 | 14 | 15 | 16 | 17 |
| | Fianna Fáil | Mary O'Rourke TD* | | 1,876 | | | | | | | | | | | | | | | | |
| | Fianna Fáil | Sen. Seán Fallon* | | 1,001 | 1,288 | | | | | | | | | | | | | | | |
| | Fianna Fáil | P.J. Coghill* | | 737 | 923 | 945 | 947 | 954 | 956 | 969 | 997 | 1,016 | 1,033 | 1,048 | 1,080 | 1,096 | 1,207 | | | |
| | Independent | Stephen Price | | 773 | 800 | 804 | 810 | 838 | 843 | 850 | 876 | 888 | 938 | 954 | 996 | 1,083 | 1,355 | | | |
| | Fine Gael | Vincent Dooley | | 598 | 605 | 606 | 606 | 612 | 621 | 637 | 644 | 658 | 667 | 705 | 734 | 747 | 772 | 777 | 795 | 799 |
| | Fine Gael | George Allen* | | 592 | 605 | 606 | 606 | 611 | 625 | 668 | 675 | 691 | 717 | 811 | 847 | 867 | 903 | 913 | 962 | 966 |
| | Fine Gael | Brendan McFadden* | | 591 | 620 | 626 | 626 | 629 | 665 | 754 | 764 | 822 | 880 | 1,035 | 1,103 | 1,184 | | | | |
| | Fianna Fáil | John Dillon* | | 494 | 515 | 529 | 534 | 546 | 548 | 551 | 560 | 562 | 566 | 572 | 586 | 603 | | | | |
| | Independent | Oliver Gavin | | 319 | 357 | 361 | 367 | 367 | 372 | 376 | 408 | 432 | 502 | 509 | 555 | | | | | |
| | Fianna Fáil | Padraic Dunne | | 318 | 404 | 450 | 451 | 455 | 464 | 476 | 494 | 509 | 532 | 559 | 615 | 681 | 755 | 760 | 807 | 842 |
| | Fine Gael | Des Lynch | | 293 | 309 | 311 | 311 | 311 | 335 | 388 | 390 | 409 | 430 | | | | | | |
| | Fine Gael | Kevin O'Brien | | 266 | 276 | 277 | 277 | 277 | 283 | | | | | | | | | | | |
| | Labour | John Henson | | 256 | 278 | 281 | 284 | 295 | 321 | 328 | 371 | 432 | 457 | 483 | | | | | | |
| | Labour | John Keenehan | | 248 | 273 | 280 | 282 | 286 | 319 | 324 | 340 | | | | | | | | | |
| | Independent | Frank Waters | | 241 | 280 | 288 | 290 | 292 | 300 | 315 | 344 | 384 | | | | | | | | |
| | Sinn Féin | Tony Hogan | | 230 | 242 | 243 | 292 | 302 | 304 | 307 | | | | | | | | | | |
| | Labour | Neil O'Shea | | 161 | 178 | 181 | 181 | 192 | | | | | | | | | | | | |
| | Labour | Michael McCallon | | 97 | 101 | 101 | 105 | | | | | | | | | | | | | |
| | Sinn Féin | Gerald Farrell | | 85 | 88 | 89 | | | | | | | | | | | | | | |
| Electorate: 15,067 Valid: 9,306 (62.88%) Spoilt: 168 Quota: 1,164 Turnout: 9,474 |
Coole: 4 seats | Party | Candidate | FPv% | Count |
| 1 | 2 | 3 | 4 | 5 | 6 | 7 | 8 |
| | Fianna Fáil | Sen. Donie Cassidy | | 1,284 | | | | | | | |
| | Fianna Fáil | P.J. O'Shaughnessy* | | 899 | 959 | 996 | 1,006 | | | | |
| | Fianna Fáil | Thomas Bourke | | 683 | 750 | 753 | 813 | 868 | 868 | 900 | 943 |
| | Fine Gael | Frank McDermott* | | 575 | 601 | 684 | 705 | 935 | 936 | 1,351 | |
| | Fianna Fáil | Molly Cahill | | 401 | 510 | 518 | 535 | 538 | 540 | 570 | 625 |
| | Fine Gael | Colm Smyth | | 390 | 406 | 429 | 445 | 538 | 540 | | |
| | Fine Gael | Michael Leslie* | | 327 | 330 | 368 | 419 | | | | |
| | Labour | Paddy Jordan | | 217 | 220 | 234 | | | | | |
| | Fine Gael | Betty Leonard | | 211 | 213 | | | | | | |
| Electorate: 7,124 Valid: 4,987 (71%) Spoilt: 71 Quota: 998 Turnout: 5,058 |
Kilbeggan[edit]
Mullingar Lough Owel[edit]
Mullingar Urban[edit]
Mullingar Urban: 4 seats | Party | Candidate | FPv% | Count |
| 1 | 2 | 3 | 4 | 5 | 6 | 7 | 8 | 9 |
| | Labour | Mick Dollard | | 907 | | | | | | | | |
| | Fianna Fáil | Camillus Glynn* | | 773 | 793 | | | | | | | |
| | Independent | Frank McIntyre | | 357 | 384 | 388 | 406 | 456 | 563 | 601 | 829 | |
| | Fianna Fáil | Martin Hynes | | 353 | 361 | 364 | 366 | 453 | 518 | 536 | 622 | 643 |
| | Labour | Jack Coleman* | | 348 | 392 | 293 | 403 | 435 | 476 | 523 | | |
| | Independent | Eddie Byrne | | 272 | 282 | 284 | 288 | 304 | | | | |
| | Fine Gael | Frank Wallace | | 271 | 273 | 274 | 315 | 322 | 350 | 544 | 612 | 640 |
| | Fine Gael | Denis Burke | | 269 | 273 | 274 | 296 | 305 | 328 | | | |
| | Fianna Fáil | Kathleen Campbell | | 141 | 146 | 147 | 149 | | | | | |
| | Sinn Féin | Billy Cleary | | 105 | 108 | 108 | 108 | | | | | |
| | Fine Gael | Mary Mahon | | 101 | 105 | 105 | | | | | | |
| Electorate: 6,654 Valid: 3,897 (59.15%) Spoilt: 39 Quota: 780 Turnout: 3,936 |
References[edit]
External links[edit]
 From Wikipedia the free encyclopedia