ملف:Vostok Petit data.svg


الملف الأصلي (ملف SVG، أبعاده 1٬024 × 768 بكسل، حجم الملف: 81 كيلوبايت)
| هذا ملف من ويكيميديا كومنز. معلومات من صفحة وصفه مبينة في الأسفل. كومنز مستودع ملفات ميديا ذو رخصة حرة. |
ملخص
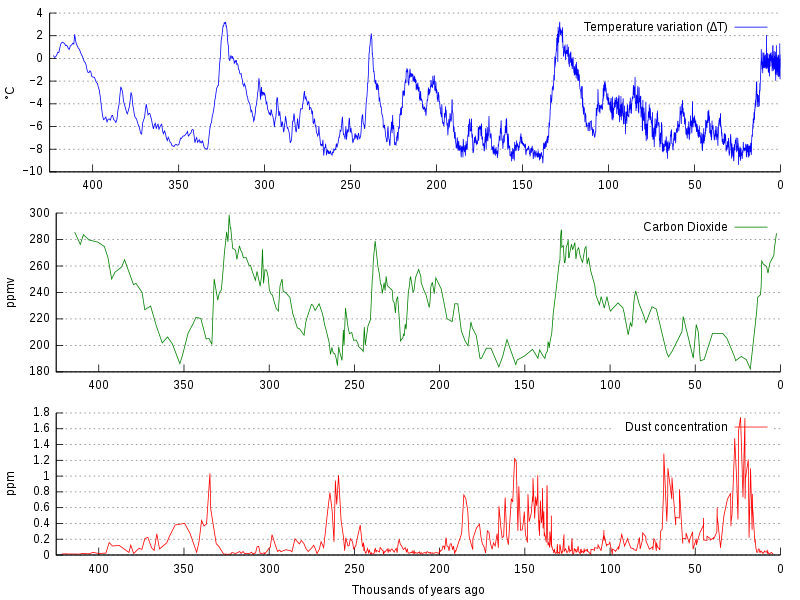
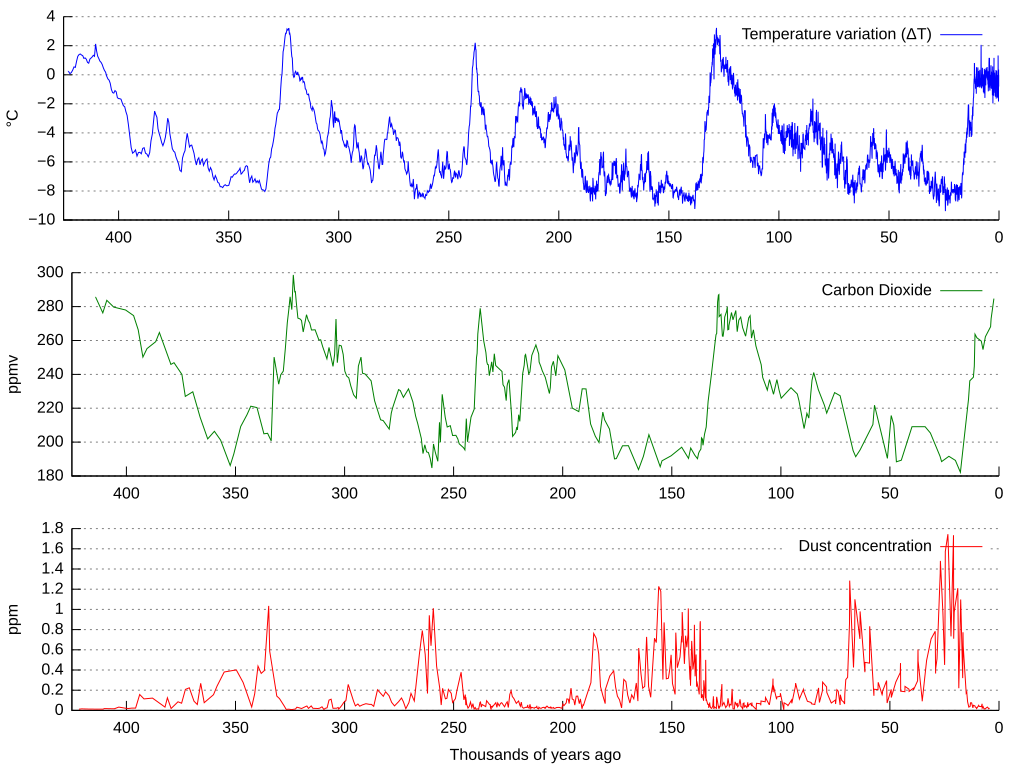
| الوصف | La bildo estas kopiita de wikipedia:en. La originala priskribo estas: Graph of CO2 (Green graph), temperature (Blue graph), and dust concentration (Red graph) measured from the Vostok, Antarctica ice core as reported by Petit et al., 1999. Higher dust levels are believed to be caused by cold, dry periods. The Earth's orbital eccentricity, tilt, and precession vary in a pattern over thousands of years. The IPCC notes that Milankovitch cycles drove the ice age cycles; CO2 followed temperature change "with a lag of some hundreds of years" (visible on a graph more zoomed in than this); and that as a feedback amplified temperature change. Among other factors, CO2 is more soluble in colder than in warmer waters. العربية: مخطّطٌ يُبيّن علاقة ثاني أوكسيد الكاربون ودرجة الحرارة وتركيز الغبار في قالب جليد فوستوك (بالإنجليزيّة: Vostok ice core) خلال 450,000 سنة الماضيّة |
| التاريخ | |
| المصدر | Own work based on: Vostok-ice-core-petit.png مِن NOAA |
| المؤلف | Original: غير معروف المتجه: |
| إصدارات أخرى | أَعمالٌ مُشتقَّة مِن هذا الملفِّ: |
| SVG منشأ الملف | الشيفرة المصدرية لهذا الرسم المتجه صالحة. هذا الرسم المتجهي أُنشئ بواسطة Gnuplot This file is translated using SVG switch elements: all translations are stored in the same file. |
Data sets used are:
- ftp://ftp.ncdc.noaa.gov/pub/data/paleo/icecore/antarctica/vostok/deutnat.txt
- ftp://ftp.ncdc.noaa.gov/pub/data/paleo/icecore/antarctica/vostok/co2nat.txt
- ftp://ftp.ncdc.noaa.gov/pub/data/paleo/icecore/antarctica/vostok/dustnat.txt
نص برمجي مصدري
Gnuplot code
unset multiplot set term svg size 1024,768 set output "vostok-data.svg" set border 3 set xtics nomirror set ytics nomirror unset xlabel unset ylabel set grid y set multiplot layout 3,1 set ylabel "°C" plot [-425:0] [-10:4] \ "deutnat.txt" \ using (-$2/1000):4 \ title "Temperature variation (ΔT)" \ ls 3 \ with lines set ylabel "ppmv" plot [-425:0] \ "co2nat.txt" \ using (-$1/1000):2 \ title "Carbon Dioxide" \ ls 2 \ with lines set xlabel "Thousands of years ago" set ylabel "ppm" plot [-425:0] \ "dustnat.txt" \ using (-$1/1000):2 \ title "Dust concentration" \ ls 1 \ with lines Explanation
After executing gnuplot, the resulting SVG file was manually changed to * remove the negative signs for the x axis values * change the [[:w:hyphen-minus|hyphen-minus]] characters in the temperature axis values to proper minus sign characters | هذا الملفُّ مُرخَّص بموجب رخصة المشاع الإبداعي نسبة المُصنَّف إِلى مُؤَلِّفه - المشاركة بالمثل 3.0 العامة | ||
| ||
| تمت إضافة علامة الترخيص لهذا الملف كجزء من رخصة جنو للوثائق الحرة تحديث الترخيص. |
 | يسمح نسخ وتوزيع و/أو تعديل هذه الوثيقة تحت شروط رخصة جنو للوثائق الحرة، الإصدار 1.2 أو أي إصدار لاحق تنشره مؤسسة البرمجيات الحرة؛ دون أقسام ثابتة ودون نصوص أغلفة أمامية ودون نصوص أغلفة خلفية. نسخة من الرخصة تم تضمينها في القسم المسمى GNU Free Documentation License. |
سجلُّ الرَّفع الأصيل
This image is a derivative work of the following images:
- Vostok-ice-core-petit.png licensed with Cc-by-sa-3.0-migrated, GFDL
- 2006-02-15T20:38:10Z Maksim 598x441 (31557 Bytes) La bildo estas kopiita de wikipedia:en. La originala priskribo estas: Graph of [[carbon dioxide|CO2]], [[temperature]], and dust concentration measured from the [[Vostok, Antarctica]] [[ice core]] as reported by Petit et al.
Uploaded with derivativeFX
تاريخ الملف
اضغط على زمن/تاريخ لرؤية الملف كما بدا في هذا الزمن.
| زمن/تاريخ | صورة مصغرة | الأبعاد | مستخدم | تعليق | |
|---|---|---|---|---|---|
| حالي | 13:01، 25 يونيو 2021 | | 1٬024 × 768 (81 كيلوبايت) | Matěj Orlický | File uploaded using svgtranslate tool (https://svgtranslate.toolforge.org/). Added translation for cs. |
| 22:25، 30 نوفمبر 2013 |  | 1٬024 × 768 (77 كيلوبايت) | SeL media | time axis reversed | |
| 17:39، 25 سبتمبر 2011 |  | 1٬024 × 768 (309 كيلوبايت) | Hel-hama | text improved | |
| 03:07، 27 أبريل 2011 |  | 1٬024 × 768 (83 كيلوبايت) | Awickert | Didn't realize that it was a draw-on box instead of a measuring-box. Take 3! | |
| 03:05، 27 أبريل 2011 |  | 1٬024 × 768 (83 كيلوبايت) | Awickert | [Shoot - last time, picked original instead of new version to upload] Manually moved axes in Inkscape such that the three plots line up with one another | |
| 03:02، 27 أبريل 2011 |  | 1٬024 × 768 (75 كيلوبايت) | Awickert | Manually moved axes in Inkscape such that the three plots line up with one another | |
| 13:25، 20 يونيو 2010 |  | 1٬024 × 768 (75 كيلوبايت) | Autopilot | {{Information |Description=La bildo estas kopiita de wikipedia:en. La originala priskribo estas: Graph of CO<sub>2</sub> (Green graph), temperature (Blue graph), and dust concentration (Red graph) measured from the [[Vostok, Antarc |
استخدام الملف
الصفحتان التاليتان تستخدمان هذا الملف:
الاستخدام العالمي للملف
الويكيات الأخرى التالية تستخدم هذا الملف:
- الاستخدام في af.wikipedia.org
- الاستخدام في be.wikipedia.org
- الاستخدام في bg.wikipedia.org
- الاستخدام في ca.wikipedia.org
- الاستخدام في cs.wikipedia.org
- الاستخدام في cy.wikipedia.org
- الاستخدام في da.wikipedia.org
- الاستخدام في de.wikipedia.org
- الاستخدام في en.wikipedia.org
- Climate variability and change
- Global cooling
- Ice core
- Orbital forcing
- Quaternary glaciation
- Carbon dioxide in Earth's atmosphere
- Talk:Ice age/Archive 1
- File talk:Vostok Petit data.svg
- List of periods and events in climate history
- User talk:Jc-S0CO/Archives/2013/2
- User:Mark Buchanan/sandbox/QuatGlac
- User:Mark Buchanan/sandbox/Glaciation-WIP
- Portal:Climate change
- Talk:Climate variability and change/Archive 8
- الاستخدام في en.wikiversity.org
- الاستخدام في es.wikipedia.org
- الاستخدام في eu.wikipedia.org
- الاستخدام في fa.wikipedia.org
- الاستخدام في fi.wikipedia.org
- الاستخدام في fi.wikiversity.org
- الاستخدام في fr.wikipedia.org
- الاستخدام في gl.wikipedia.org
- الاستخدام في ha.wikipedia.org
- الاستخدام في he.wikipedia.org
- الاستخدام في it.wikipedia.org
- الاستخدام في ja.wikipedia.org
- الاستخدام في jv.wikipedia.org
- الاستخدام في ka.wikipedia.org
اعرض المزيد من الاستخدام العام لهذا الملف.